Hello traders,
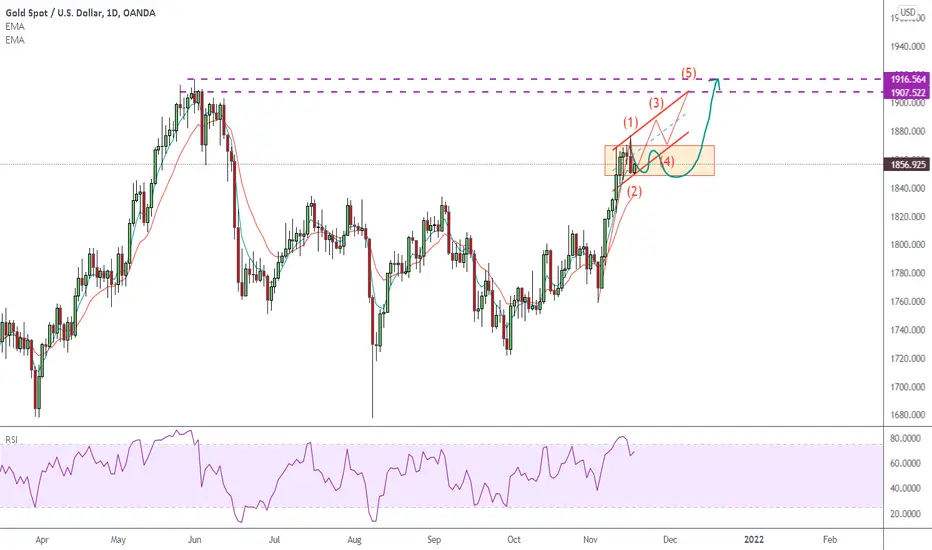
GOLD is facing two ways to reach 1900-1911 zone on daily chart.
It would go sideways inside the red rectangle to consolidate before new leg up to test new high.
Or
it would continue to rise in a rough way insidw a flat red channel till it hit the 1900-1911 zone.
Both ways would need you to setup in a lower timeframe chart .
The correction idea in my last idea is not valid anymore with new price action.
RISK LOWER THAN YOUR TOLERANCE:
Suggested Risk <5%
Your Real Entry Position Will Make Different RR for Your Trade.
GOOD LUCK!!!
LESS IS MORE!
거래청산: 스탑 닿음
Join Free Telegram Group to get MORE trading skills: t.me/FuntraderVera
관련 발행물
면책사항
이 정보와 게시물은 TradingView에서 제공하거나 보증하는 금융, 투자, 거래 또는 기타 유형의 조언이나 권고 사항을 의미하거나 구성하지 않습니다. 자세한 내용은 이용 약관을 참고하세요.
Join Free Telegram Group to get MORE trading skills: t.me/FuntraderVera
관련 발행물
면책사항
이 정보와 게시물은 TradingView에서 제공하거나 보증하는 금융, 투자, 거래 또는 기타 유형의 조언이나 권고 사항을 의미하거나 구성하지 않습니다. 자세한 내용은 이용 약관을 참고하세요.