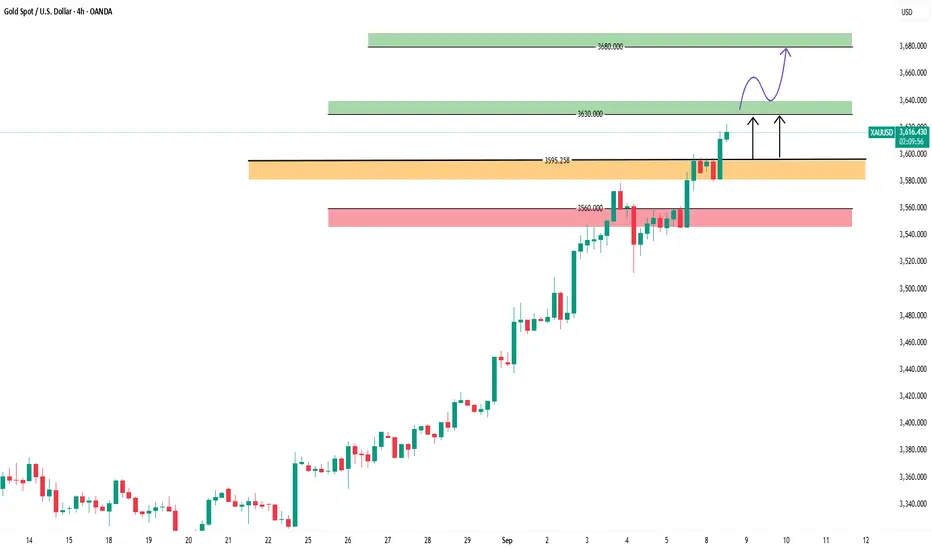
🔹 If price trades above 3595:
• The trend will likely continue upward toward the resistance level at 3630.
• A breakout above 3630 and holding above it (on the 4-hour or 1-hour candle) would confirm a continuation upward toward 3680.
⸻
🔹 If price fails and breaks below 3595:
• The trend will likely move downward toward the support level at 3560.
• This support is strong, but if it is broken, the trend may fully shift into a deeper decline.
⸻
📌 In short:
• Above 3595 → bullish trend (targets 3630 → 3680).
• Below 3595 → bearish trend (targets 3560 → further downside).
액티브 트레이드
• The price moved as we predicted and reached our target.
• If it holds above 3630, the uptrend could continue toward 3680.
면책사항
이 정보와 게시물은 TradingView에서 제공하거나 보증하는 금융, 투자, 거래 또는 기타 유형의 조언이나 권고 사항을 의미하거나 구성하지 않습니다. 자세한 내용은 이용 약관을 참고하세요.
면책사항
이 정보와 게시물은 TradingView에서 제공하거나 보증하는 금융, 투자, 거래 또는 기타 유형의 조언이나 권고 사항을 의미하거나 구성하지 않습니다. 자세한 내용은 이용 약관을 참고하세요.