Chart Observation (5m timeframe):
Trend:
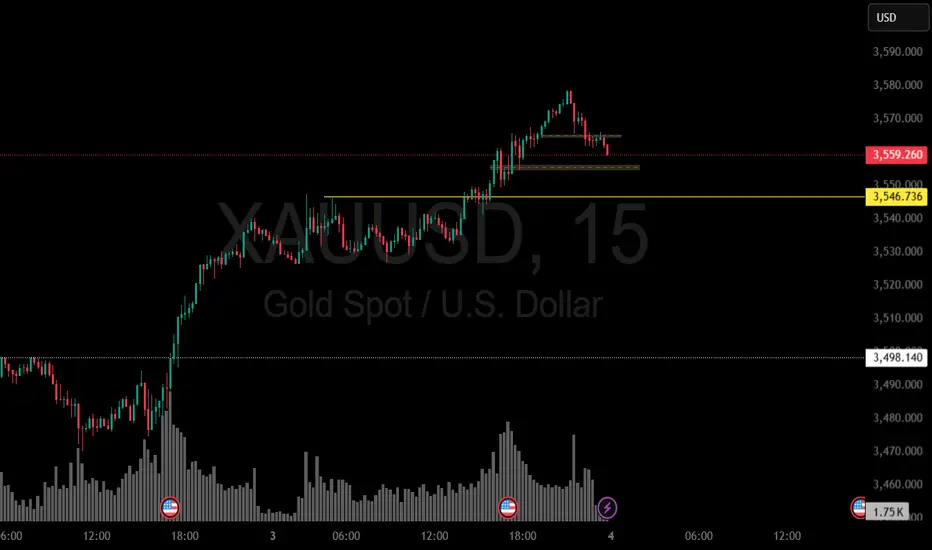
Gold is currently in a strong bullish trend – you can see higher highs and higher lows forming consistently.
Volume Spike:
The rally after 18:00 came with increasing volume, showing strong buying interest and liquidity injection.
Resistance Zone:
Current price = 3576
The round psychological level is 3580 – 3600 (a possible short-term resistance).
Support / Demand Zone:
Immediate demand zone: 3550 – 3560 (recent consolidation before the breakout).
Deeper support: 3520 – 3530 (if price retraces hard).
📊 Price Action Analysis
Since market is trending up, buying is safer than selling.
A small correction may occur soon (because price is extended), but as long as 3550 holds, the trend remains bullish.
✅ Trading Plan
Buying Area (Best Entries):
3550 – 3560 zone (ideal pullback entry).
If that breaks, 3520 – 3530 is the next strong demand zone.
Selling Area (Short Entries):
Around 3580 – 3600 (short-term resistance, scalp sell possible).
But selling is counter-trend, so take quick profits only.
Trend Bias:
Bullish. Wait for retracements to enter long instead of chasing high candles.
⚠️ Pro Tip:
Mark the 3550 level on your chart – if 5m candle closes strong below it, short-term bearish correction possible. If it holds, next target = 3600+.
Trend:
Gold is currently in a strong bullish trend – you can see higher highs and higher lows forming consistently.
Volume Spike:
The rally after 18:00 came with increasing volume, showing strong buying interest and liquidity injection.
Resistance Zone:
Current price = 3576
The round psychological level is 3580 – 3600 (a possible short-term resistance).
Support / Demand Zone:
Immediate demand zone: 3550 – 3560 (recent consolidation before the breakout).
Deeper support: 3520 – 3530 (if price retraces hard).
📊 Price Action Analysis
Since market is trending up, buying is safer than selling.
A small correction may occur soon (because price is extended), but as long as 3550 holds, the trend remains bullish.
✅ Trading Plan
Buying Area (Best Entries):
3550 – 3560 zone (ideal pullback entry).
If that breaks, 3520 – 3530 is the next strong demand zone.
Selling Area (Short Entries):
Around 3580 – 3600 (short-term resistance, scalp sell possible).
But selling is counter-trend, so take quick profits only.
Trend Bias:
Bullish. Wait for retracements to enter long instead of chasing high candles.
⚠️ Pro Tip:
Mark the 3550 level on your chart – if 5m candle closes strong below it, short-term bearish correction possible. If it holds, next target = 3600+.
면책사항
이 정보와 게시물은 TradingView에서 제공하거나 보증하는 금융, 투자, 거래 또는 기타 유형의 조언이나 권고 사항을 의미하거나 구성하지 않습니다. 자세한 내용은 이용 약관을 참고하세요.
면책사항
이 정보와 게시물은 TradingView에서 제공하거나 보증하는 금융, 투자, 거래 또는 기타 유형의 조언이나 권고 사항을 의미하거나 구성하지 않습니다. 자세한 내용은 이용 약관을 참고하세요.