🧭 General Overview
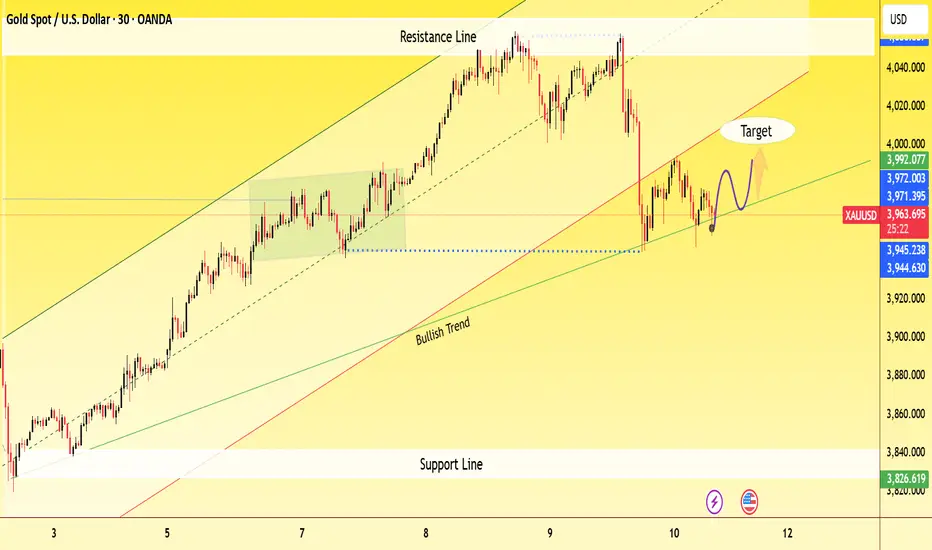
Instrument: Gold Spot / USD (XAU/USD)
Timeframe: 30-minute
Current Price: 3,958.59
Trend: Overall bullish, but showing short-term correction
📊 Key Technical Elements on Chart
1. Bullish Trendline
The green upward trendline labeled “Bullish Trend” indicates that gold remains in a long-term uptrend.
Price is currently testing this bullish trendline — a crucial support area.
2. Resistance Zone
The resistance line near 3,992–4,000 marks the recent swing high where price was rejected.
Each approach to this zone triggered a pullback, indicating strong selling pressure ther
액티브 트레이드
Gis holding above 4000 support area continuation upward channel. The market structure shows uptrend momentum and phase the targets beyond 4007 0n strength.t.me/PRICEACTIONFOREX007
IAM FOREX PROFESSIONAL TRADER IAM PROVIDING BEST AND HUGE PROFITABLE FORECASTS
t.me/PRICEACTIONFOREX007
IAM FOREX PROFESSIONAL TRADER IAM PROVIDING BEST AND HUGE PROFITABLE FORECASTS
t.me/PRICEACTIONFOREX007
면책사항
이 정보와 게시물은 TradingView에서 제공하거나 보증하는 금융, 투자, 거래 또는 기타 유형의 조언이나 권고 사항을 의미하거나 구성하지 않습니다. 자세한 내용은 이용 약관을 참고하세요.
t.me/PRICEACTIONFOREX007
IAM FOREX PROFESSIONAL TRADER IAM PROVIDING BEST AND HUGE PROFITABLE FORECASTS
t.me/PRICEACTIONFOREX007
IAM FOREX PROFESSIONAL TRADER IAM PROVIDING BEST AND HUGE PROFITABLE FORECASTS
t.me/PRICEACTIONFOREX007
면책사항
이 정보와 게시물은 TradingView에서 제공하거나 보증하는 금융, 투자, 거래 또는 기타 유형의 조언이나 권고 사항을 의미하거나 구성하지 않습니다. 자세한 내용은 이용 약관을 참고하세요.