https://www.tradingview.com/x/a8U6vBHF/
News:
The Federal Reserve cut interest rates by 25 basis points as expected on Wednesday. However, to the market's surprise, Powell released an extremely hawkish signal, stating that a December rate cut is "far from a certainty," which directly caused a market crash. US stocks fell from their highs, the dollar rose, and gold and silver markets plummeted. The Fed also postponed the pause in its balance sheet reduction program until December.
This has temporarily tightened market expectations for a December rate cut, meaning that the expectation of a rate cut has temporarily failed to materialize. However, there is still more than a month until mid-December, and with fluctuations in data, expectations are likely to rise again.
Specifically:
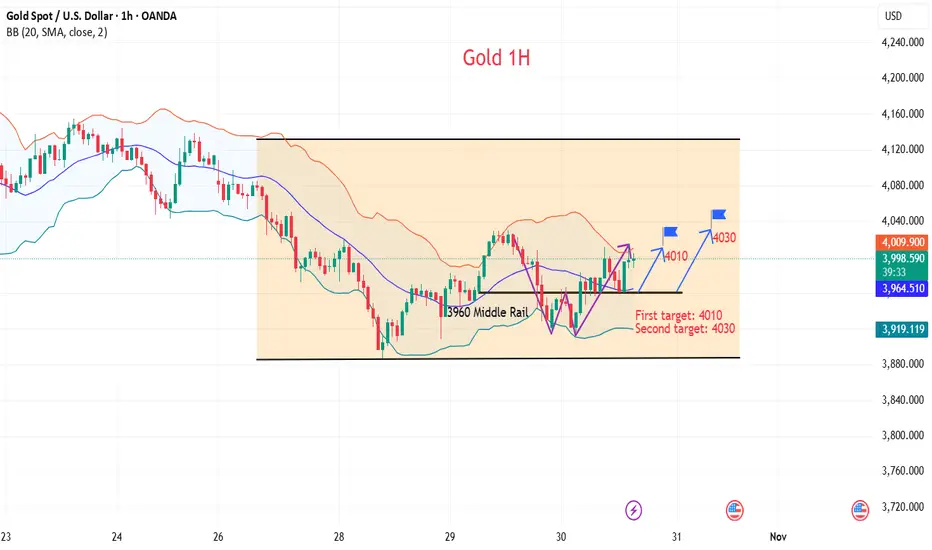
Gold hourly chart: Today's price action was relatively volatile, with poor continuity and high deceptiveness. For example, the large bearish candle at 11:00 AM led many to believe a breakdown and weakness, following the overnight decline. However, a small W-shaped rally broke through the morning's opening price level.
[Note: For those who entered near the middle band, the stop-loss can be moved up to the cost basis for protection. That way, it becomes a risk-free position, and you can hold it with confidence.]
Trading strategy:
Buy:3965-3960, SL: 3950, TP: 3980-4010-4030
News:
The Federal Reserve cut interest rates by 25 basis points as expected on Wednesday. However, to the market's surprise, Powell released an extremely hawkish signal, stating that a December rate cut is "far from a certainty," which directly caused a market crash. US stocks fell from their highs, the dollar rose, and gold and silver markets plummeted. The Fed also postponed the pause in its balance sheet reduction program until December.
This has temporarily tightened market expectations for a December rate cut, meaning that the expectation of a rate cut has temporarily failed to materialize. However, there is still more than a month until mid-December, and with fluctuations in data, expectations are likely to rise again.
Specifically:
Gold hourly chart: Today's price action was relatively volatile, with poor continuity and high deceptiveness. For example, the large bearish candle at 11:00 AM led many to believe a breakdown and weakness, following the overnight decline. However, a small W-shaped rally broke through the morning's opening price level.
[Note: For those who entered near the middle band, the stop-loss can be moved up to the cost basis for protection. That way, it becomes a risk-free position, and you can hold it with confidence.]
Trading strategy:
Buy:3965-3960, SL: 3950, TP: 3980-4010-4030
액티브 트레이드
Gold prices are hovering around the $4,000 mark. What's next?거래청산: 타겟 닿음
Gold prices hovered around the $4,000 mark after reaching the third target.I'm Theodore, welcome to join my channel, where you can get the latest trading signals and strategy layout.
관련 발행물
면책사항
해당 정보와 게시물은 금융, 투자, 트레이딩 또는 기타 유형의 조언이나 권장 사항으로 간주되지 않으며, 트레이딩뷰에서 제공하거나 보증하는 것이 아닙니다. 자세한 내용은 이용 약관을 참조하세요.
I'm Theodore, welcome to join my channel, where you can get the latest trading signals and strategy layout.
관련 발행물
면책사항
해당 정보와 게시물은 금융, 투자, 트레이딩 또는 기타 유형의 조언이나 권장 사항으로 간주되지 않으며, 트레이딩뷰에서 제공하거나 보증하는 것이 아닙니다. 자세한 내용은 이용 약관을 참조하세요.