Gold hourly chart;
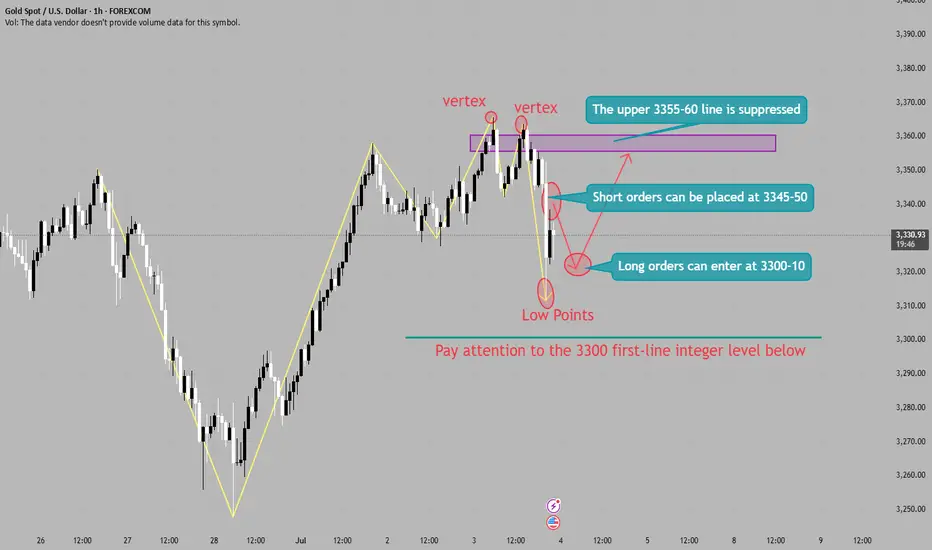
Gold short-term analysis; Gold 4-hour analysis shows that the stochastic indicator is golden cross, which is a bullish signal; MACD indicator double lines stick together upward, which is a bullish signal; 4-hour bias continues to rise; 4-hour downward trend channel is temporarily suppressed, and the pressure position is around 3355-60.
Gold short-term analysis; Gold 4-hour analysis shows that the stochastic indicator is golden cross, which is a bullish signal; MACD indicator double lines stick together upward, which is a bullish signal; 4-hour bias continues to rise; 4-hour downward trend channel is temporarily suppressed, and the pressure position is around 3355-60.
액티브 트레이드
We only provide general trend direction and operation ideas, and publish market trend analysis and operation strategy analysis every day. If you need to verify our analysis strength, you can click the link to see it yourself. When you fully recognize our trading logic, consider whether to participate in real-time operations; if you need to obtain more detailed operation strategies and stop-profit and stop-loss plans, you can consult through the homepage link. If you have any doubts, it is recommended to continue to observe to avoid invalid time costs - after all, investment needs to focus on value, not formal communication. 👇👇👇t.me/+lQIvgUv8CKZiMDI0
면책사항
해당 정보와 게시물은 금융, 투자, 트레이딩 또는 기타 유형의 조언이나 권장 사항으로 간주되지 않으며, 트레이딩뷰에서 제공하거나 보증하는 것이 아닙니다. 자세한 내용은 이용 약관을 참조하세요.
면책사항
해당 정보와 게시물은 금융, 투자, 트레이딩 또는 기타 유형의 조언이나 권장 사항으로 간주되지 않으며, 트레이딩뷰에서 제공하거나 보증하는 것이 아닙니다. 자세한 내용은 이용 약관을 참조하세요.