Hello everyone, what are your thoughts on the current trend of XAUUSD?
Contrary to expectations, gold saw a steep correction yesterday. The precious metal is now trading around 3,340 USD, roughly 30 USD lower than the previous session’s high.
This drop came after yesterday’s economic data release. Both the US Core PPI and PPI m/m surged by 0.9% (well above the 0.2% forecast), signaling significant producer inflation pressure. At the same time, Initial Jobless Claims fell slightly to 224K, better than the 225K forecast.
These figures have strengthened expectations that the Fed will be more cautious about cutting interest rates, which in turn has supported the USD and added downward pressure on XAUUSD after its previous rally.
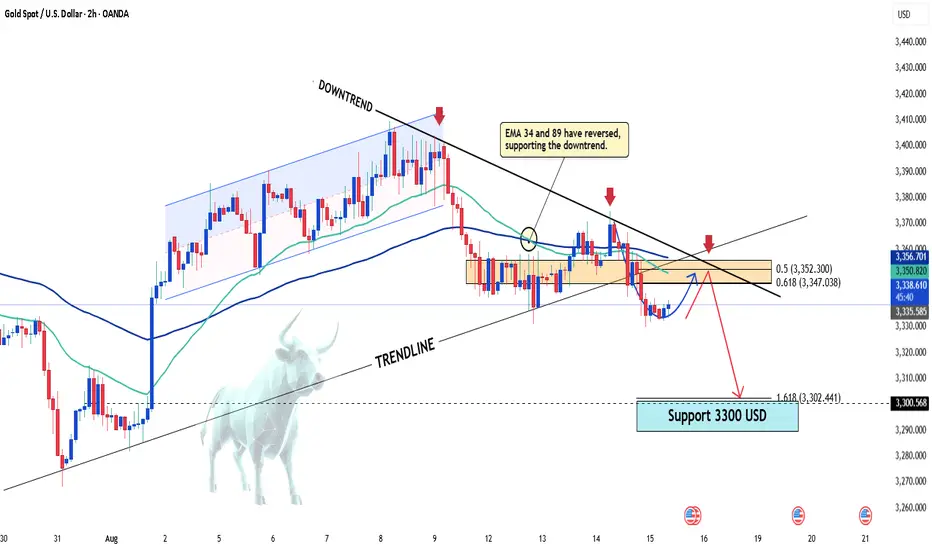
From a technical perspective, gold has lost the 3,350 USD support level and broken below the old ascending trendline, now moving under a newly formed descending trendline. The EMA 34 and EMA 89 have also reversed, further reinforcing short-term bearish sentiment.
While a corrective bounce could occur, if these bearish factors hold, sellers are likely to remain in control, with the target once again set at 3,300 USD.
Indicators and tools used in my chart:
-EMA 34, EMA 89
-Regression trend
-Fibonacci
-Support and resistance
-Trendline
Contrary to expectations, gold saw a steep correction yesterday. The precious metal is now trading around 3,340 USD, roughly 30 USD lower than the previous session’s high.
This drop came after yesterday’s economic data release. Both the US Core PPI and PPI m/m surged by 0.9% (well above the 0.2% forecast), signaling significant producer inflation pressure. At the same time, Initial Jobless Claims fell slightly to 224K, better than the 225K forecast.
These figures have strengthened expectations that the Fed will be more cautious about cutting interest rates, which in turn has supported the USD and added downward pressure on XAUUSD after its previous rally.
From a technical perspective, gold has lost the 3,350 USD support level and broken below the old ascending trendline, now moving under a newly formed descending trendline. The EMA 34 and EMA 89 have also reversed, further reinforcing short-term bearish sentiment.
While a corrective bounce could occur, if these bearish factors hold, sellers are likely to remain in control, with the target once again set at 3,300 USD.
Indicators and tools used in my chart:
-EMA 34, EMA 89
-Regression trend
-Fibonacci
-Support and resistance
-Trendline
액티브 트레이드
✅ Receive 7–10 high-quality signals daily for Forex, Gold, and Bitcoin
✅ Fast updates, accurate alerts
✅ Suitable for both beginners and experienced traders
👉 Join now by clicking this link:
t.me/+6v7LMJO7cI04Nzg1
✅ Fast updates, accurate alerts
✅ Suitable for both beginners and experienced traders
👉 Join now by clicking this link:
t.me/+6v7LMJO7cI04Nzg1
관련 발행물
면책사항
이 정보와 게시물은 TradingView에서 제공하거나 보증하는 금융, 투자, 거래 또는 기타 유형의 조언이나 권고 사항을 의미하거나 구성하지 않습니다. 자세한 내용은 이용 약관을 참고하세요.