https://www.tradingview.com/x/lHsxAyRe/
💡Message Strategy
Gold hits new all-time high as expectations of a Fed rate cut continue to build
On Tuesday (September 2nd), the international gold price broke through the $3,500 mark, reaching a new all-time high. As market expectations for a Fed rate cut this month grow, demand for precious metals has significantly increased. Spot gold traded at $3,480 in European trading, briefly hitting an intraday record high of $3,508.50.
One of the main factors driving the latest surge in gold prices is rising market expectations for a Fed rate cut, even if the cut is only 25 basis points. Following significant downward revisions to U.S. labor market data for May and June, market expectations for long-term monetary policy easing have significantly strengthened.
📊Technical aspects
First, regarding the daily gold chart: Yesterday, the market closed positively against the 5-day moving average, marking its fifth consecutive day of gains. In a unilateral uptrend, the most common pattern is a pattern of consecutive positive days followed by a single negative day. The more consecutive positive days, the stronger the trend. If a negative day occurs, it signals a short-term correction, followed by another positive close the next day. At most, there will be two negative days, and the market will continue to rise above the 5-day and, at the very least, the 10-day moving average.
This is why we've been able to perfectly grasp each of these gold market trends. Maintain a bullish trend. Believe in the trend and don't underestimate its allure.
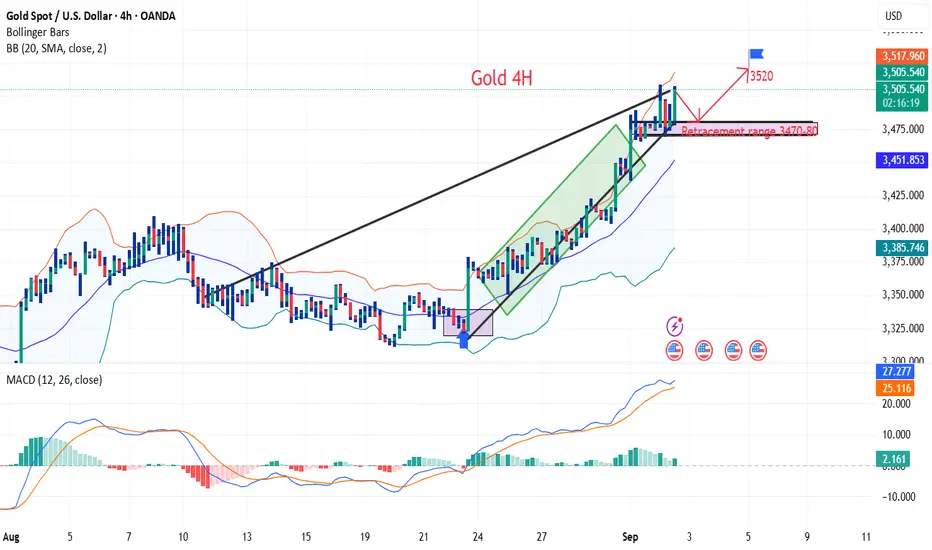
Second, regarding the 4-hour gold chart: The 6:00 PM close saw a large bearish candlestick retracing its previous close, engulfing the morning's large bullish body. However, it has only pierced the 10-day moving average and hasn't yet effectively broken through it. It has now begun to close positively and rise again. Once the 10:00 PM close re-establishes its position above the 5-day moving average, the market will strengthen again. Otherwise, if the market rises and then falls again, a move above the middle moving average would be a good low-level bullish entry point. Maintain a bullish outlook.
💰Strategy Package
Long Position:3470-3380,SL:3450,Target: 3520
💡Message Strategy
Gold hits new all-time high as expectations of a Fed rate cut continue to build
On Tuesday (September 2nd), the international gold price broke through the $3,500 mark, reaching a new all-time high. As market expectations for a Fed rate cut this month grow, demand for precious metals has significantly increased. Spot gold traded at $3,480 in European trading, briefly hitting an intraday record high of $3,508.50.
One of the main factors driving the latest surge in gold prices is rising market expectations for a Fed rate cut, even if the cut is only 25 basis points. Following significant downward revisions to U.S. labor market data for May and June, market expectations for long-term monetary policy easing have significantly strengthened.
📊Technical aspects
First, regarding the daily gold chart: Yesterday, the market closed positively against the 5-day moving average, marking its fifth consecutive day of gains. In a unilateral uptrend, the most common pattern is a pattern of consecutive positive days followed by a single negative day. The more consecutive positive days, the stronger the trend. If a negative day occurs, it signals a short-term correction, followed by another positive close the next day. At most, there will be two negative days, and the market will continue to rise above the 5-day and, at the very least, the 10-day moving average.
This is why we've been able to perfectly grasp each of these gold market trends. Maintain a bullish trend. Believe in the trend and don't underestimate its allure.
Second, regarding the 4-hour gold chart: The 6:00 PM close saw a large bearish candlestick retracing its previous close, engulfing the morning's large bullish body. However, it has only pierced the 10-day moving average and hasn't yet effectively broken through it. It has now begun to close positively and rise again. Once the 10:00 PM close re-establishes its position above the 5-day moving average, the market will strengthen again. Otherwise, if the market rises and then falls again, a move above the middle moving average would be a good low-level bullish entry point. Maintain a bullish outlook.
💰Strategy Package
Long Position:3470-3380,SL:3450,Target: 3520
액티브 트레이드
In trading, the rigid are easily broken.Only those who are extremely yin and gentle can dominate the world.
I'm Theodore, welcome to join my channel, where you can get the latest trading signals and strategy layout.
관련 발행물
면책사항
이 정보와 게시물은 TradingView에서 제공하거나 보증하는 금융, 투자, 거래 또는 기타 유형의 조언이나 권고 사항을 의미하거나 구성하지 않습니다. 자세한 내용은 이용 약관을 참고하세요.
I'm Theodore, welcome to join my channel, where you can get the latest trading signals and strategy layout.
관련 발행물
면책사항
이 정보와 게시물은 TradingView에서 제공하거나 보증하는 금융, 투자, 거래 또는 기타 유형의 조언이나 권고 사항을 의미하거나 구성하지 않습니다. 자세한 내용은 이용 약관을 참고하세요.