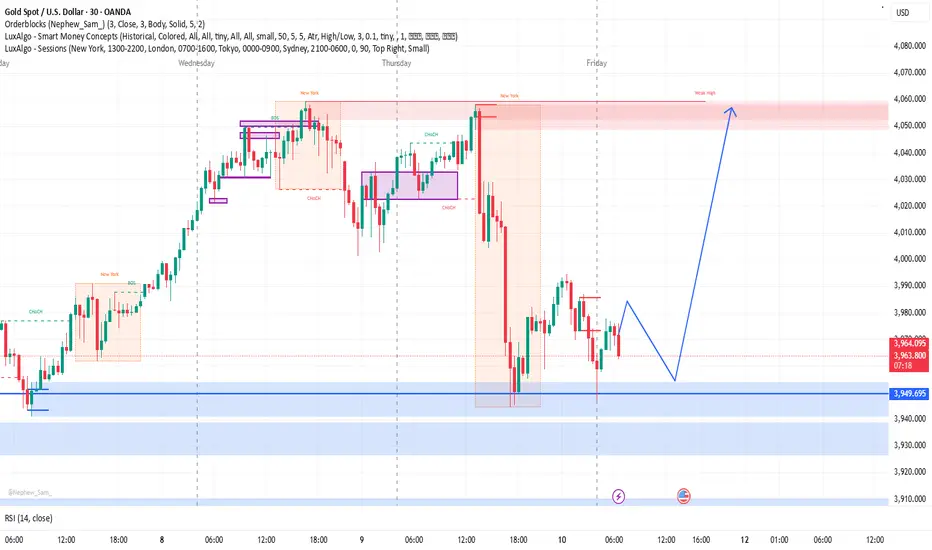
The chart shows the 30-minute timeframe of XAU/USD (Gold Spot vs. U.S. Dollar) with a clear Smart Money Concepts (SMC) analysis using LuxAlgo indicators. The market recently experienced a sharp drop after hitting a resistance zone marked by an order block and a weak high near the 3,976 level. Currently, the price is retracing after tapping into a strong demand zone around 3,947–3,950, suggesting potential bullish interest. The projected blue line indicates a possible bullish move after a short-term retracement, aiming for a return to the previous high. The RSI at around 43 signals neutral momentum, supporting the possibility of either consolidation or a reversal from this key support area.
면책사항
해당 정보와 게시물은 금융, 투자, 트레이딩 또는 기타 유형의 조언이나 권장 사항으로 간주되지 않으며, 트레이딩뷰에서 제공하거나 보증하는 것이 아닙니다. 자세한 내용은 이용 약관을 참조하세요.
면책사항
해당 정보와 게시물은 금융, 투자, 트레이딩 또는 기타 유형의 조언이나 권장 사항으로 간주되지 않으며, 트레이딩뷰에서 제공하거나 보증하는 것이 아닙니다. 자세한 내용은 이용 약관을 참조하세요.