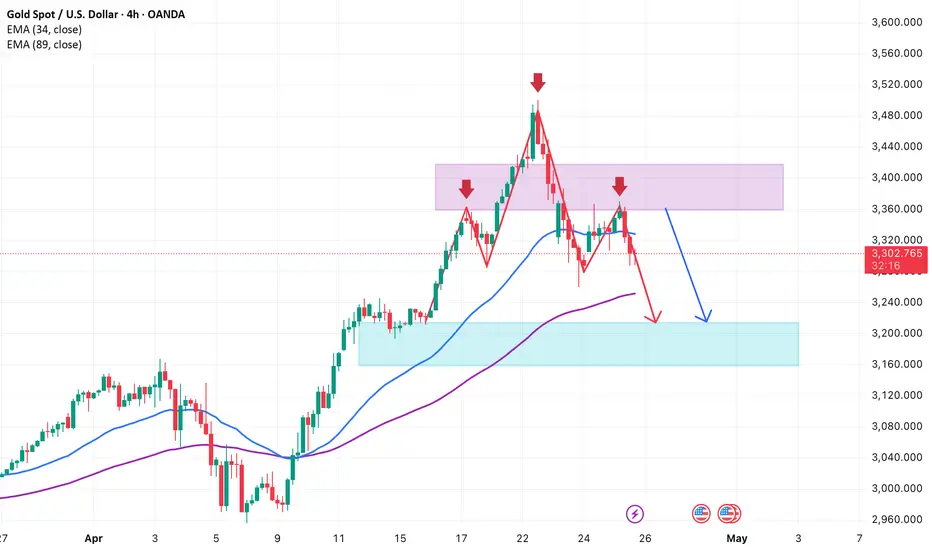
On the H4 chart, the gold price chart is forming a clear bearish structure after forming a three-peak pattern in a row around the $3,435–$3,470 range. Each time the price touches this range, it is strongly rejected, indicating that selling pressure controls the market. The fact that the price cannot maintain above the EMA34 and EMA9 at the same time is also a sign of confirmation of a weakening trend in the short term.
Although gold recovered slightly to the $3,365 range in the Asian session on April 25 thanks to news of PBOC money injection and a weakening USD, the buying pressure was not enough to break the bearish structure. The price quickly reversed and fell below the $3,300 mark, confirming the possibility of further correction in the near future.
Currently, the price has cut below the two EMAs and broken the nearest bottom at $3,290, triggering a bearish signal according to the “small head and shoulders” pattern on the H4. The next target is the strong support zone of $3,180–$3,220. If this zone is broken, the correction trend may extend deeper to the $3,100 area.
The appropriate short-term strategy at this time is to wait for the price to retrace to the $3,310–$3,330 area, cut losses above $3,350 and take profits around $3,200. The bullish scenario will only happen if the price breaks above $3,370 and closes above the old resistance – then the bearish structure will be broken.
액티브 트레이드
면책사항
해당 정보와 게시물은 금융, 투자, 트레이딩 또는 기타 유형의 조언이나 권장 사항으로 간주되지 않으며, 트레이딩뷰에서 제공하거나 보증하는 것이 아닙니다. 자세한 내용은 이용 약관을 참조하세요.
면책사항
해당 정보와 게시물은 금융, 투자, 트레이딩 또는 기타 유형의 조언이나 권장 사항으로 간주되지 않으며, 트레이딩뷰에서 제공하거나 보증하는 것이 아닙니다. 자세한 내용은 이용 약관을 참조하세요.