Last week we repeatedly emphasized the importance of paying attention to the rising trend line of the 4H cycle. Until the price falls below this trend line, we will maintain our bullish stance. Although news of easing trade tensions between China and the United States over the weekend has brought a slight cooling to the market's tense mood, this has only temporarily suspended the bullish counterattack. Whether a real and effective consensus can be reached still requires attention to the APEC summit at the end of the month.
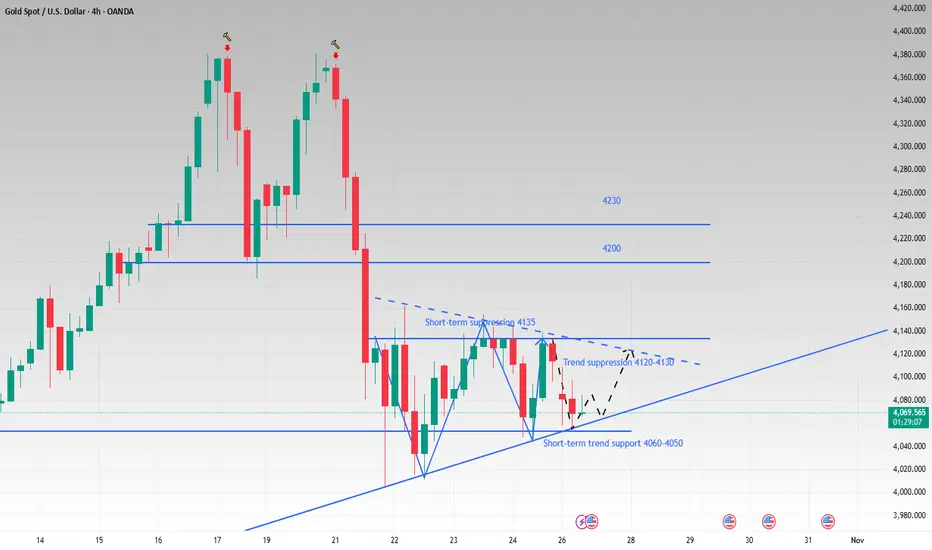
At the same time, the Federal Reserve's interest rate cut this week is almost a foregone conclusion, which has provided some support for the rise in gold prices. This has also contributed to the current relatively flat trend in gold prices, without as much fluctuation as last week. In addition to the rising trend line that we have been paying attention to, there is also a small downward trend line in the 4H chart, which makes the current trend fall into a triangle consolidation range.
The short-term support below is 4060-4050, and the trend suppression above is 4120-4130. Before the triangle pattern breaks to determine the future trading direction, we can sell high and buy low around this range.
The current hourly moving average is arranged downward, and it is expected to test the lower support again. If it falls back to the lower support and does not break, we can consider going long on gold.
Free trading signal group, real-time guidance please enter: t.me/AllenPrecise_analysis
관련 발행물
면책사항
이 정보와 게시물은 TradingView에서 제공하거나 보증하는 금융, 투자, 거래 또는 기타 유형의 조언이나 권고 사항을 의미하거나 구성하지 않습니다. 자세한 내용은 이용 약관을 참고하세요.
Free trading signal group, real-time guidance please enter: t.me/AllenPrecise_analysis
관련 발행물
면책사항
이 정보와 게시물은 TradingView에서 제공하거나 보증하는 금융, 투자, 거래 또는 기타 유형의 조언이나 권고 사항을 의미하거나 구성하지 않습니다. 자세한 내용은 이용 약관을 참고하세요.