✅ Daily Chart: The Bollinger Bands continue to expand, and spot gold is trading near the upper band, showing strong momentum. The MACD is running in a golden cross, and the RSI has rebounded from oversold territory, indicating that gold has clear demand for a bottom rebound.
However, close attention should be paid to the 3450–3455 trendline resistance. If the price fails to break above this level effectively, it could limit further upside potential.
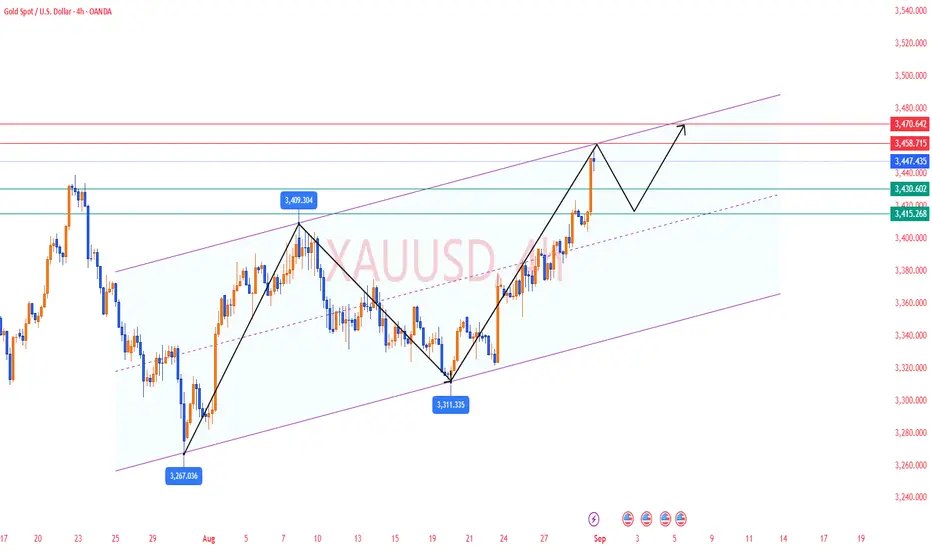
✅ 4-Hour Chart: The Bollinger Bands are opening upward, with gold trading just below the upper band. The MACD golden cross momentum is narrowing, and the RSI has retreated from overbought levels, suggesting that the upward trend is slowing and that short-term correction pressure may emerge.
✅ 1-Hour Chart: Gold is currently trading near the middle Bollinger Band. The MACD has formed a death cross, and the RSI has fallen back from overbought levels, indicating weakening upward momentum and highlighting the risk of a pullback after overbought conditions.
🔴 Resistance Level: 3450–3455
🟢 Support Level: 3415–3420
✅ Trading Strategy Reference:
🔰 Long Strategy: The overall trend remains bullish, so the main approach is to buy on pullbacks. If gold retraces to the 3415–3420 support zone and holds, light long positions may be considered with targets at 3440–3450.
🔰 Short Strategy: If the price tests the 3450–3455 resistance zone multiple times without a valid breakout, and bearish signals such as divergence or a shooting star candlestick appear, light short positions can be considered. Stop-loss above 3460, with downside targets at 3430–3420.
✅ Conclusion:
Gold is currently in a high-level consolidation phase after rebounding, with upward momentum showing signs of weakening. The key for Monday’s trading lies in whether the 3450–3455 resistance zone can be broken. The recommended approach is to buy on pullbacks as the primary strategy, and sell on rebounds as a secondary strategy, while strictly enforcing stop-loss measures to control risk.
However, close attention should be paid to the 3450–3455 trendline resistance. If the price fails to break above this level effectively, it could limit further upside potential.
✅ 4-Hour Chart: The Bollinger Bands are opening upward, with gold trading just below the upper band. The MACD golden cross momentum is narrowing, and the RSI has retreated from overbought levels, suggesting that the upward trend is slowing and that short-term correction pressure may emerge.
✅ 1-Hour Chart: Gold is currently trading near the middle Bollinger Band. The MACD has formed a death cross, and the RSI has fallen back from overbought levels, indicating weakening upward momentum and highlighting the risk of a pullback after overbought conditions.
🔴 Resistance Level: 3450–3455
🟢 Support Level: 3415–3420
✅ Trading Strategy Reference:
🔰 Long Strategy: The overall trend remains bullish, so the main approach is to buy on pullbacks. If gold retraces to the 3415–3420 support zone and holds, light long positions may be considered with targets at 3440–3450.
🔰 Short Strategy: If the price tests the 3450–3455 resistance zone multiple times without a valid breakout, and bearish signals such as divergence or a shooting star candlestick appear, light short positions can be considered. Stop-loss above 3460, with downside targets at 3430–3420.
✅ Conclusion:
Gold is currently in a high-level consolidation phase after rebounding, with upward momentum showing signs of weakening. The key for Monday’s trading lies in whether the 3450–3455 resistance zone can be broken. The recommended approach is to buy on pullbacks as the primary strategy, and sell on rebounds as a secondary strategy, while strictly enforcing stop-loss measures to control risk.
✅𝐃𝐚𝐢𝐥𝐲 𝟐-𝟒 𝐓𝐫𝐚𝐝𝐢𝐧𝐠 𝐒𝐢𝐠𝐧𝐚𝐥𝐬🔥
✅𝐇𝐢𝐠𝐡 𝐀𝐜𝐜𝐮𝐫𝐚𝐜𝐲 𝟗𝟎%-𝟗𝟓% 🔥
✅𝐖𝐞𝐞𝐤𝐥𝐲 𝐲𝐢𝐞𝐥𝐝 𝟔𝟎%-𝟖𝟓%🔥
👉Free Channel:t.me/+AMHhMKEIj_IzN2Vl
✉️VIP Guidance : t.me/Jack_blackwell
✅𝐇𝐢𝐠𝐡 𝐀𝐜𝐜𝐮𝐫𝐚𝐜𝐲 𝟗𝟎%-𝟗𝟓% 🔥
✅𝐖𝐞𝐞𝐤𝐥𝐲 𝐲𝐢𝐞𝐥𝐝 𝟔𝟎%-𝟖𝟓%🔥
👉Free Channel:t.me/+AMHhMKEIj_IzN2Vl
✉️VIP Guidance : t.me/Jack_blackwell
면책사항
이 정보와 게시물은 TradingView에서 제공하거나 보증하는 금융, 투자, 거래 또는 기타 유형의 조언이나 권고 사항을 의미하거나 구성하지 않습니다. 자세한 내용은 이용 약관을 참고하세요.