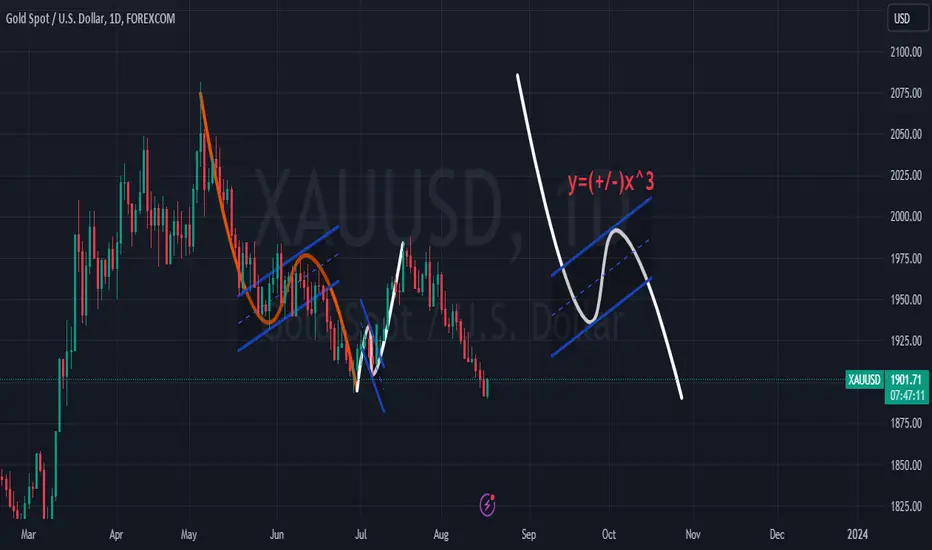
The curve represented by y=x^3 is highly regarded in financial charting. This particular graph is pivotal for various financial charts, notably in the gold and oil sectors. The chart often commences with a Hunt candle in a High High is typically positioned in a descending orientation and a Low Low is typically positioned in a ascending orientation.
Importantly, this graph can manifest in two conditions: when positive and rising, it aligns within an ascending channel, and when negative and falling, it is set within a descending channel. I've illustrated this in the gold chart in daily time frame.
Thus, investors should be on the lookout for either of these scenarios. If a downward trend is observed, it's advised to make a robust purchase at the base of the descending channel. Conversely, in the presence of an upward trend, a strong sell is recommended at the peak of the ascending channel.
Sincerely Yours,
MT
거래청산: 타겟 닿음
Be careful about this pattern.MT
면책사항
이 정보와 게시물은 TradingView에서 제공하거나 보증하는 금융, 투자, 거래 또는 기타 유형의 조언이나 권고 사항을 의미하거나 구성하지 않습니다. 자세한 내용은 이용 약관을 참고하세요.
면책사항
이 정보와 게시물은 TradingView에서 제공하거나 보증하는 금융, 투자, 거래 또는 기타 유형의 조언이나 권고 사항을 의미하거나 구성하지 않습니다. 자세한 내용은 이용 약관을 참고하세요.