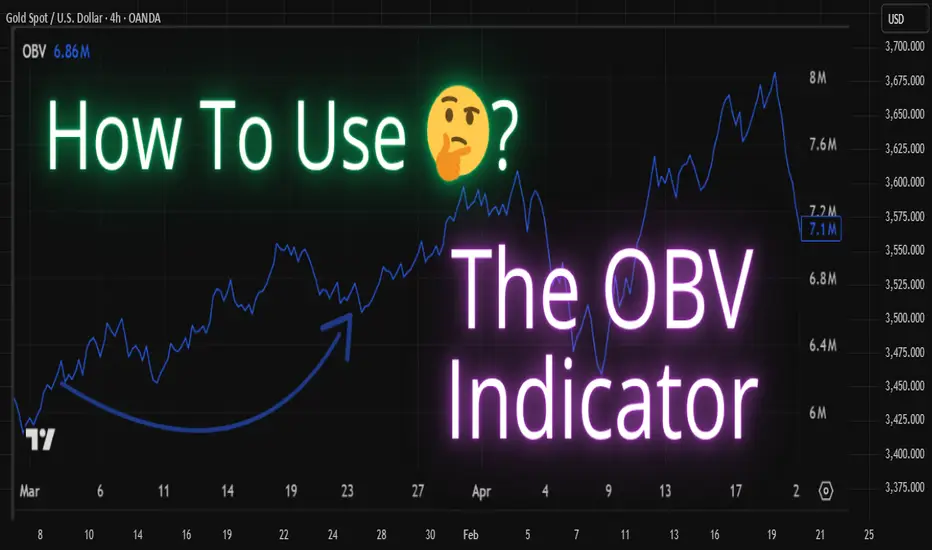
The OBV (On-Balance Volume) is a classic volume-based indicator that helps traders measure buying and selling pressure using volume flow. It was developed by Joseph Granville and is widely used to confirm price trends or spot early signs of reversals.
🔍 How OBV Works:
The OBV line is calculated by adding volume on up days and subtracting volume on down days.
* If the closing price is higher than the previous close, that candle's volume is added to OBV.
* If the closing price is lower, the volume is subtracted.
This creates a cumulative volume line that reflects how volume is flowing with price action.
📊 What OBV Tells You:
✅ A rising OBV suggests accumulation (buying pressure)

✅ A falling OBV suggests distribution (selling pressure)

✅ Divergence between OBV and price can signal potential reversals

📌 Example Use Cases:
🔹 Confirming breakouts and breakdowns
🔹 Spotting hidden strength or weakness
🔹 Identifying bullish or bearish divergences
🛠 OBV is most powerful when combined with trendlines, moving averages, or other price action tools.
Disclaimer :
This Post is not financial advice, it's for educational purposes only, I am not a SEBI-registered advisor. Trading and investing involve risk, and you should consult with a qualified financial advisor before making any trading decisions. I do not guarantee profits or take responsibility for any losses you may incur.
🔍 How OBV Works:
The OBV line is calculated by adding volume on up days and subtracting volume on down days.
* If the closing price is higher than the previous close, that candle's volume is added to OBV.
* If the closing price is lower, the volume is subtracted.
This creates a cumulative volume line that reflects how volume is flowing with price action.
📊 What OBV Tells You:
✅ A rising OBV suggests accumulation (buying pressure)
✅ A falling OBV suggests distribution (selling pressure)
✅ Divergence between OBV and price can signal potential reversals
📌 Example Use Cases:
🔹 Confirming breakouts and breakdowns
🔹 Spotting hidden strength or weakness
🔹 Identifying bullish or bearish divergences
🛠 OBV is most powerful when combined with trendlines, moving averages, or other price action tools.
Disclaimer :
This Post is not financial advice, it's for educational purposes only, I am not a SEBI-registered advisor. Trading and investing involve risk, and you should consult with a qualified financial advisor before making any trading decisions. I do not guarantee profits or take responsibility for any losses you may incur.
Shivam mandai
면책사항
이 정보와 게시물은 TradingView에서 제공하거나 보증하는 금융, 투자, 거래 또는 기타 유형의 조언이나 권고 사항을 의미하거나 구성하지 않습니다. 자세한 내용은 이용 약관을 참고하세요.
Shivam mandai
면책사항
이 정보와 게시물은 TradingView에서 제공하거나 보증하는 금융, 투자, 거래 또는 기타 유형의 조언이나 권고 사항을 의미하거나 구성하지 않습니다. 자세한 내용은 이용 약관을 참고하세요.
