Gold is showing some wild moves lately, and I think a reversal might be on the horizon based on a possible divergence on the RSI. Check out this 4-hour chart from TradingView—let’s break it down!
The Setup:
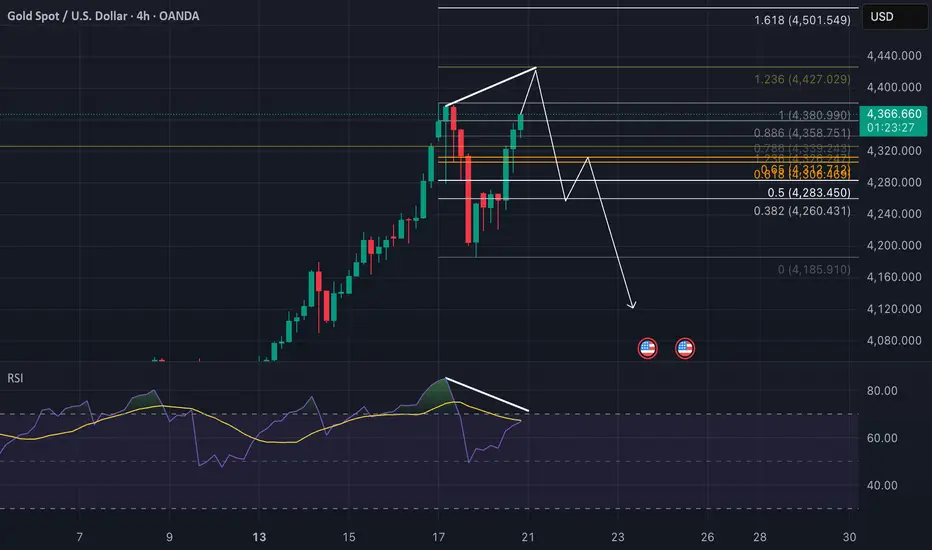
We’ve seen gold climbing recently, hitting a peak around $4,380 before dropping back. The RSI looks like it’s diverging, hinting that momentum might be fading that could be a sign of a reversal incoming!
* Two Possible Plays
1) Double Top & Retest: We might see a double top forming, followed by a drop to retest the recent bottom liquidity levels around $4,120-$4,160.
2) Divergence & Retest: The RSI divergence could lead to the same retest of those bottom liquidity levels, giving us a chance to see where it bounces.
Key Technicals: RSI is showing a potential divergence aka momentum weakening while price peaked.
Support zone sits around $4,120-$4,160.
Resistance is near the recent high of $4,366.
Trade Idea (not financial advice):
Watch for a break below $4,160 to confirm the retest, or a bounce from there for a potential long. If it drops past $4,080, might be time to rethink. Targets? Could/or would climb back to $4,366 or higher if momentum kicks in!
Summary:
Gold’s at a crossroads with a possible reversal brewing. Whether it’s a double top or RSI divergence, the next move might retest those lower levels. Keep an eye on it, it can get interesting soon!
P.s. sure it can also continue its growth, so before proceeding with any type of entry find your reversal structure on lower timefrae. GL!
The Setup:
We’ve seen gold climbing recently, hitting a peak around $4,380 before dropping back. The RSI looks like it’s diverging, hinting that momentum might be fading that could be a sign of a reversal incoming!
* Two Possible Plays
1) Double Top & Retest: We might see a double top forming, followed by a drop to retest the recent bottom liquidity levels around $4,120-$4,160.
2) Divergence & Retest: The RSI divergence could lead to the same retest of those bottom liquidity levels, giving us a chance to see where it bounces.
Key Technicals: RSI is showing a potential divergence aka momentum weakening while price peaked.
Support zone sits around $4,120-$4,160.
Resistance is near the recent high of $4,366.
Trade Idea (not financial advice):
Watch for a break below $4,160 to confirm the retest, or a bounce from there for a potential long. If it drops past $4,080, might be time to rethink. Targets? Could/or would climb back to $4,366 or higher if momentum kicks in!
Summary:
Gold’s at a crossroads with a possible reversal brewing. Whether it’s a double top or RSI divergence, the next move might retest those lower levels. Keep an eye on it, it can get interesting soon!
P.s. sure it can also continue its growth, so before proceeding with any type of entry find your reversal structure on lower timefrae. GL!
거래청산: 타겟 닿음
This was really funny, because there was actual divergence 😀 Previuos ath = 4380.990
Current ath = 4381.440
and RSI 85 vs 66
So, in terms of the rules, it is divergence, after what gold fell to 0.382 fib (from last growth) and hit lowest point at 4245.245.
I closed trade with a profit, and will consider to re-enter it after 0.65 fib retest.
Good luck!
노트
And boom, final target was reached! 😎😎😎 면책사항
이 정보와 게시물은 TradingView에서 제공하거나 보증하는 금융, 투자, 거래 또는 기타 유형의 조언이나 권고 사항을 의미하거나 구성하지 않습니다. 자세한 내용은 이용 약관을 참고하세요.
면책사항
이 정보와 게시물은 TradingView에서 제공하거나 보증하는 금융, 투자, 거래 또는 기타 유형의 조언이나 권고 사항을 의미하거나 구성하지 않습니다. 자세한 내용은 이용 약관을 참고하세요.