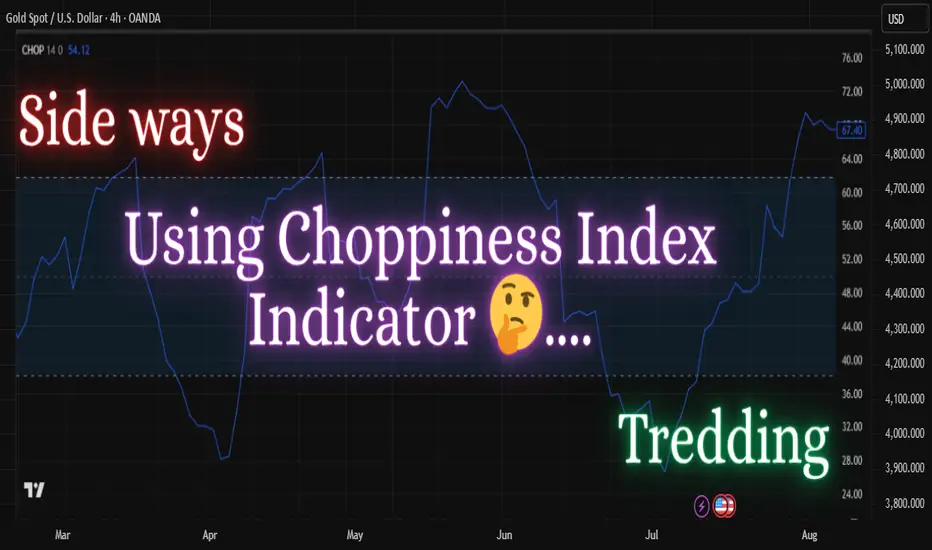
the choppiness index is a volatility-based indicator designed to determine whether the market is trending or consolidating. it doesn’t predict direction, but helps traders identify the nature of price movement — choppy or directional.
🔍 how it works:
* the indicator ranges from 0 to 100.
* values above 60 usually indicate a sideways or consolidating market.

* values below 40 suggest a trending market (either up or down).

* the closer it is to 100, the more choppy the market; the closer to 0, the stronger the trend.
🧠 how to use it in trading:
1. use choppiness index to filter trades — avoid trading trend-based strategies during high choppiness.
2. combine it with a trend-following indicator (like moving average or adx) to confirm entries when the choppiness index is low.
3. during low choppiness, you can also trail your stops more aggressively as the market is likely trending.
⚙️ custom settings tip:
some traders use fibonacci levels (38.2 and 61.8) as thresholds. you can adjust the period (default is often 14) based on your timeframe and strategy.
💡 example usage:
* wait for the choppiness index to fall below 38.2.
* then look for a breakout or moving average crossover to align your trade in the direction of the trend.
🎯 summary:
the choppiness index helps you avoid trading during indecisive market conditions and improves your strategy’s timing by telling you when the market is likely to move. it's best used as a filter alongside other indicators.
Disclaimer :
This idea post is not financial advice, it's for educational purposes only, I am not a SEBI-registered advisor. Trading and investing involve risk, and you should consult with a qualified financial advisor before making any trading decisions. I do not guarantee profits or take responsibility for any losses you may incur.
🔍 how it works:
* the indicator ranges from 0 to 100.
* values above 60 usually indicate a sideways or consolidating market.
* values below 40 suggest a trending market (either up or down).
* the closer it is to 100, the more choppy the market; the closer to 0, the stronger the trend.
🧠 how to use it in trading:
1. use choppiness index to filter trades — avoid trading trend-based strategies during high choppiness.
2. combine it with a trend-following indicator (like moving average or adx) to confirm entries when the choppiness index is low.
3. during low choppiness, you can also trail your stops more aggressively as the market is likely trending.
⚙️ custom settings tip:
some traders use fibonacci levels (38.2 and 61.8) as thresholds. you can adjust the period (default is often 14) based on your timeframe and strategy.
💡 example usage:
* wait for the choppiness index to fall below 38.2.
* then look for a breakout or moving average crossover to align your trade in the direction of the trend.
🎯 summary:
the choppiness index helps you avoid trading during indecisive market conditions and improves your strategy’s timing by telling you when the market is likely to move. it's best used as a filter alongside other indicators.
Disclaimer :
This idea post is not financial advice, it's for educational purposes only, I am not a SEBI-registered advisor. Trading and investing involve risk, and you should consult with a qualified financial advisor before making any trading decisions. I do not guarantee profits or take responsibility for any losses you may incur.
Shivam mandai
면책사항
이 정보와 게시물은 TradingView에서 제공하거나 보증하는 금융, 투자, 거래 또는 기타 유형의 조언이나 권고 사항을 의미하거나 구성하지 않습니다. 자세한 내용은 이용 약관을 참고하세요.
Shivam mandai
면책사항
이 정보와 게시물은 TradingView에서 제공하거나 보증하는 금융, 투자, 거래 또는 기타 유형의 조언이나 권고 사항을 의미하거나 구성하지 않습니다. 자세한 내용은 이용 약관을 참고하세요.