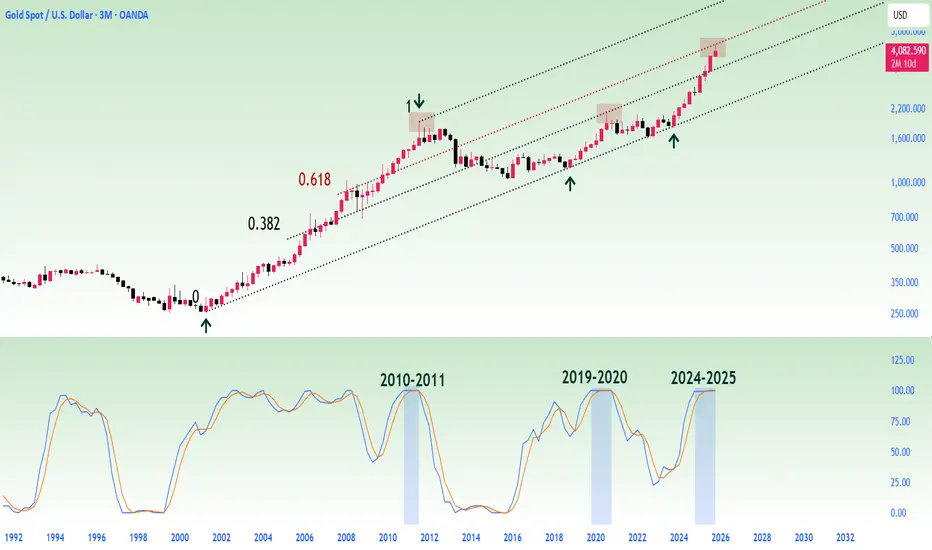
Gold has been rejected at the 0.618 level of the Fibonacci channel on the 3M chart.
The Stoch RSI demonstrates a striking similarity to past cycles:
The bullish structure, which continued in the overbought region in October 2010, peaked 273 days later in July 2011.
Momentum, which continued in the overbought region again in October 2019, reached its peak 365 days later in October 2020.
Today, history paints a similar picture once again.
The bullish structure, which began in the overbought region in October 2024, may have reached its peak approximately one year later, in October 2025, just as in previous cycles.
Gold appears to be completing its historical rhythm once again.
면책사항
이 정보와 게시물은 TradingView에서 제공하거나 보증하는 금융, 투자, 거래 또는 기타 유형의 조언이나 권고 사항을 의미하거나 구성하지 않습니다. 자세한 내용은 이용 약관을 참고하세요.
면책사항
이 정보와 게시물은 TradingView에서 제공하거나 보증하는 금융, 투자, 거래 또는 기타 유형의 조언이나 권고 사항을 의미하거나 구성하지 않습니다. 자세한 내용은 이용 약관을 참고하세요.