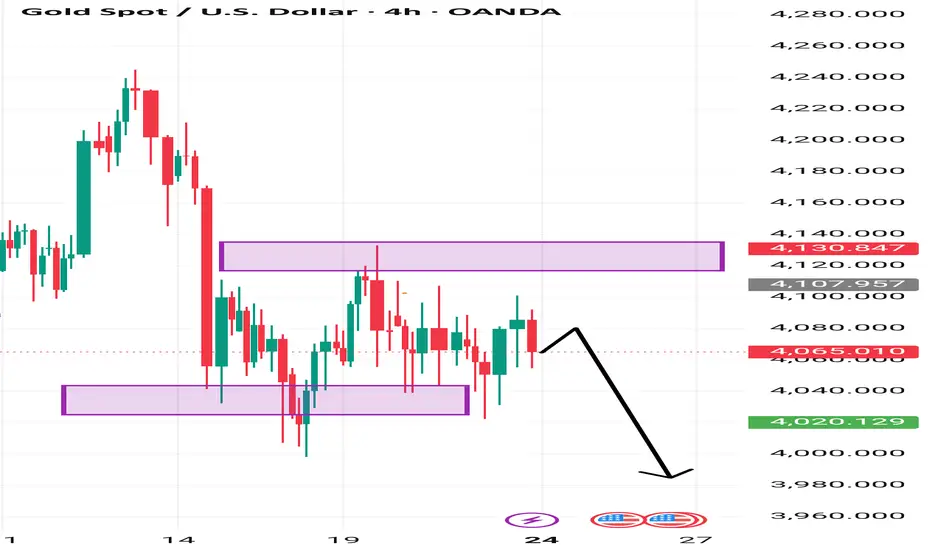
Why a Drop Makes Sense (Bearish Bias)
✔ Repeated rejections from the upper supply zone
The large purple zone around 4120–4130 has already rejected price multiple times
→ showing strong sellers there.
✔ Lower highs forming
The candles show a series of lower highs, meaning bulls are failing to push up.
✔ Price failing to break 4080–4090
This zone is acting as strong intraday resistance.
Your arrow shows price retesting it — that is a typical retracement before continuation down.
We share XAUUSD (Gold) signals based on market analysis.
Educational content to help traders make informed decisions.
Educational content to help traders make informed decisions.
면책사항
해당 정보와 게시물은 금융, 투자, 트레이딩 또는 기타 유형의 조언이나 권장 사항으로 간주되지 않으며, 트레이딩뷰에서 제공하거나 보증하는 것이 아닙니다. 자세한 내용은 이용 약관을 참조하세요.
We share XAUUSD (Gold) signals based on market analysis.
Educational content to help traders make informed decisions.
Educational content to help traders make informed decisions.
면책사항
해당 정보와 게시물은 금융, 투자, 트레이딩 또는 기타 유형의 조언이나 권장 사항으로 간주되지 않으며, 트레이딩뷰에서 제공하거나 보증하는 것이 아닙니다. 자세한 내용은 이용 약관을 참조하세요.