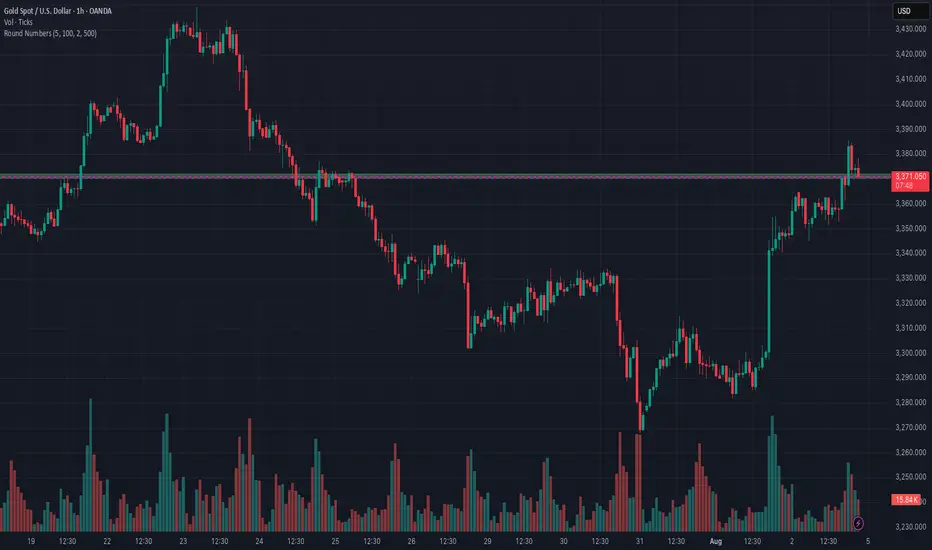
This chart highlights key price areas using two important indicators:
🔹 Volume – Helps identify high-activity zones where buyers and sellers are most engaged. Spikes in volume often signal strong interest or potential reversals.
🔹 Round Numbers – Psychological levels (e.g., 100, 500, 1000) where price tends to react due to trader bias. These act as natural support/resistance zones.
📊 Use Case:
Look for volume spikes near round numbers to find high-probability reversal or breakout setups.
Combine this with price action for better entry/exit signals.
🧠 Tip: Round number zones with strong volume support often act as key levels during trend continuation or reversal.
면책사항
이 정보와 게시물은 TradingView에서 제공하거나 보증하는 금융, 투자, 거래 또는 기타 유형의 조언이나 권고 사항을 의미하거나 구성하지 않습니다. 자세한 내용은 이용 약관을 참고하세요.
면책사항
이 정보와 게시물은 TradingView에서 제공하거나 보증하는 금융, 투자, 거래 또는 기타 유형의 조언이나 권고 사항을 의미하거나 구성하지 않습니다. 자세한 내용은 이용 약관을 참고하세요.