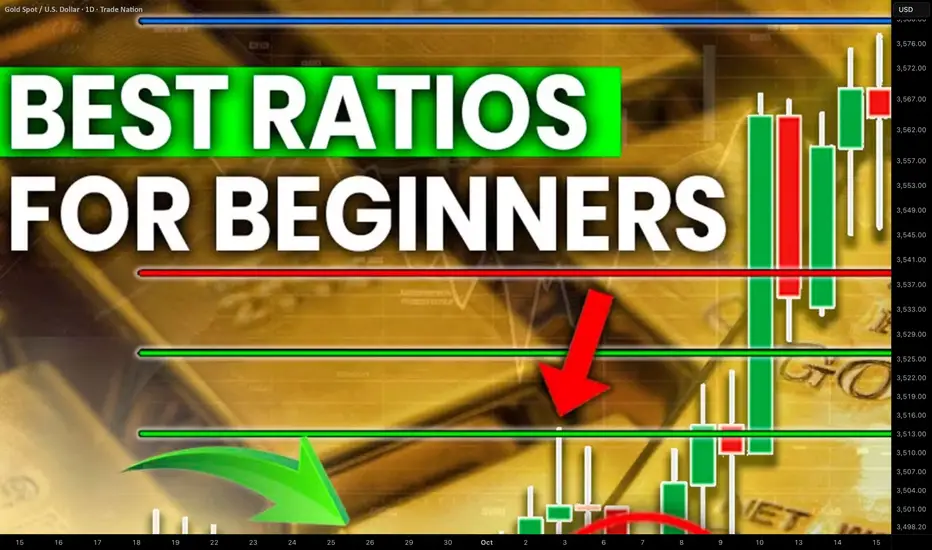
I will teach you a simple but efficient way of using Fibonacci levels for Gold analysis.
You will learn the strongest Fib.retracement levels and a proven strategy for XAUUSD trading.
First, let me show you the most powerful Fibonacci retracement levels that you should use for trading Gold.
The most significant ones are: 382, 50, 618, 786.
To use these Fib.Retracement levels properly, you will need to find the strongest 3 impulse legs.
Please, note that you can execute Fibonacci analysis of Gold on any time frame, for the sake of the example, we will do that on a daily.
Here are 3 impulses that I found.
I was simply trying to identify the price waves with the strongest impact. I underlined them from their lows to their highs.
We will draw Fibonacci Retracement levels based on these 3 movements.
- We plot Fib.Retracement of a bullish impulse from its low to its high.
- We plot Fib.Retracement of a bearish impulse from its high to its low.
That is how it looks.
After that we will need to find a confluence - zones or levels where Fib.Retracement levels of different impulses match.
Such zones will be significant liquidity clusters where market participants will place huge volumes of trading orders.
The first 2 confluence zones that I spotted on a Gold chart will be specific. They are based on 1 and 0 Fib.Retracement levels that match.
These 2 areas are both completion and starting points of our impulse legs.
The fact that significant price movements completed and started after tests of these zones indicates their significance.
Confluence zones 3/4/5/6 are based on a convergence of at least 2 Fib.Retracement levels of different impulses.
Probabilities will be high that these zones will attract the market liquidity.
After we found all confluence zones, I recommend removing Fibonacci levels from the chart to keep it clean.
That is how our complete Fib.Analysis will look.
From these zones, we will look for trading opportunities.
The areas that are above current price levels will be significant supply areas, and we will look for sell signals from them.
The zones that are below Gold spot price will be demand areas. Chances will be high that a strong buying reaction will follow after their test.
Confluence zones that we spotted on Gold chart provide unique perspective. Integrating them in your XAUUSD analysis, you will increase the accuracy of your predictions and trading decisions.
❤️Please, support my work with like, thank you!❤️
I am part of Trade Nation's Influencer program and receive a monthly fee for using their TradingView charts in my analysis.
✅Join My Telegram Channel: t.me/VasilyTrading
❗️YouTube Channel youtube.com/c/VasilyTrader
✅ Facebook: facebook.com/VasilyTrading/
⭐ My Forex & Gold Broker: bit.ly/vasilyforexbroker ⭐
❗️YouTube Channel youtube.com/c/VasilyTrader
✅ Facebook: facebook.com/VasilyTrading/
⭐ My Forex & Gold Broker: bit.ly/vasilyforexbroker ⭐
관련 발행물
면책사항
해당 정보와 게시물은 금융, 투자, 트레이딩 또는 기타 유형의 조언이나 권장 사항으로 간주되지 않으며, 트레이딩뷰에서 제공하거나 보증하는 것이 아닙니다. 자세한 내용은 이용 약관을 참조하세요.

