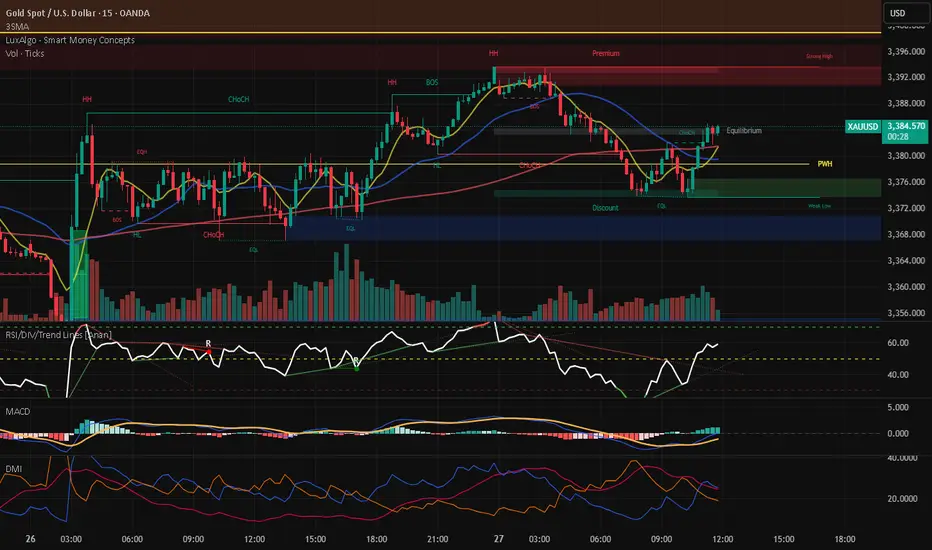
Gold (XAUUSD) is forming an **Ascending Triangle** pattern on the 4H chart.
🔹 Key Resistance
* The **3400 – 3440** zone is acting as a strong ceiling for price.
* A breakout and consolidation above this level could trigger the next bullish wave.
🔹 Supports
* Dynamic Support: Short-term ascending trendline.
* Static Supports: **3320 – 3340**, and if broken, the next support lies at **3260 – 3280**.
🔹 Scenarios
✅ Bullish Scenario:
If price breaks and holds above **3440**, next targets may extend towards **3480 – 3520** and even **3560**.
❌ Bearish Scenario:
If the ascending trendline and **3320** support fail, a deeper correction towards **3260 – 3280** is likely.
🔹 Volume
Decreasing volume in recent moves indicates the market is in a **waiting phase** for a decisive breakout either up or down.
---
📌 Summary:
The current structure suggests buyers have the upper hand, but confirmation will only come with a breakout above **3440**. Risk management is crucial in this area.
면책사항
이 정보와 게시물은 TradingView에서 제공하거나 보증하는 금융, 투자, 거래 또는 기타 유형의 조언이나 권고 사항을 의미하거나 구성하지 않습니다. 자세한 내용은 이용 약관을 참고하세요.
면책사항
이 정보와 게시물은 TradingView에서 제공하거나 보증하는 금융, 투자, 거래 또는 기타 유형의 조언이나 권고 사항을 의미하거나 구성하지 않습니다. 자세한 내용은 이용 약관을 참고하세요.
