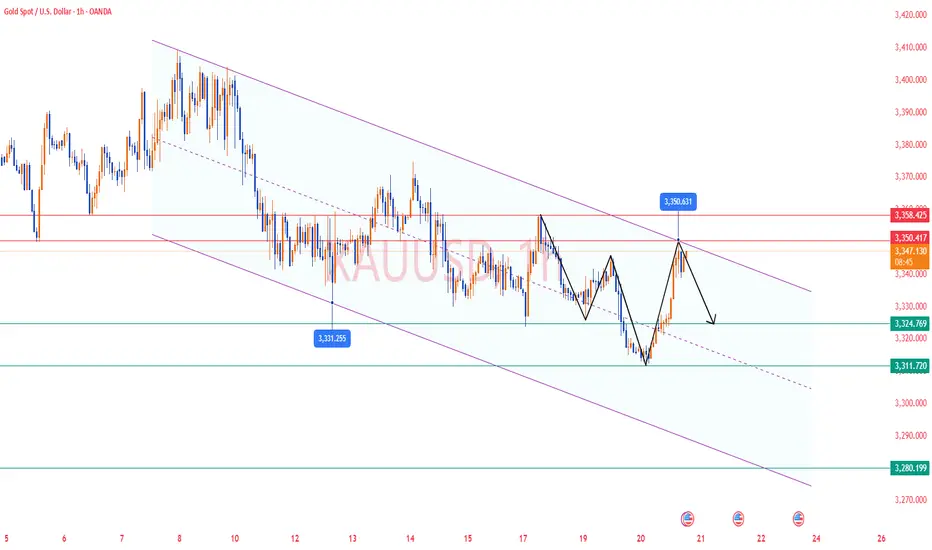
✅ From the 4-hour chart, gold prices are still moving within a broad downward channel. The current rebound is mainly a correction after the previous continuous decline.
Indicator signals show: the MACD has formed a golden cross at the lows, with the histogram turning positive, indicating stronger rebound momentum; the KDJ has quickly risen from oversold levels but has entered the mid-to-high range, suggesting that while rebound momentum continues, the upside potential is limited. Gold is rebounding, but the overall medium-term trend remains bearish. The 3345–3355 zone is a strong resistance area; if the price faces rejection there, bears may regain control.
On the downside, 3325 is short-term support; if it breaks, the next pullback targets are 3310–3305. A more critical support lies at 3280–3268.
✅ Trend Outlook: Gold is currently in a corrective rebound phase. Short-term momentum favors the bulls, but the medium-term trend remains bearish.
🔴 Resistance Levels: 3345–3350 / 3355–3360
🟢 Support Levels: 3325 / 3310–3305 / 3280–3268
✅ Trading Strategy Reference:
🔰 If gold rebounds to the 3345–3350 area and faces rejection, consider entering short positions, targeting 3325–3310.
🔰 If the price breaks above and holds 3355–3360, the rebound may extend toward the 3380 area.
🔰 If gold breaks below 3310, the rebound phase is over, and the trend may return to the downside.
🔥Trading Reminder: Trading strategies are time-sensitive, and market conditions can change rapidly. Please adjust your trading plan based on real-time market conditions.
✅𝐃𝐚𝐢𝐥𝐲 𝟐-𝟒 𝐓𝐫𝐚𝐝𝐢𝐧𝐠 𝐒𝐢𝐠𝐧𝐚𝐥𝐬🔥
✅𝐇𝐢𝐠𝐡 𝐀𝐜𝐜𝐮𝐫𝐚𝐜𝐲 𝟗𝟎%-𝟗𝟓% 🔥
✅𝐖𝐞𝐞𝐤𝐥𝐲 𝐲𝐢𝐞𝐥𝐝 𝟔𝟎%-𝟖𝟓%🔥
👉Free Channel:t.me/+AMHhMKEIj_IzN2Vl
✉️VIP Guidance : t.me/Jack_blackwell
✅𝐇𝐢𝐠𝐡 𝐀𝐜𝐜𝐮𝐫𝐚𝐜𝐲 𝟗𝟎%-𝟗𝟓% 🔥
✅𝐖𝐞𝐞𝐤𝐥𝐲 𝐲𝐢𝐞𝐥𝐝 𝟔𝟎%-𝟖𝟓%🔥
👉Free Channel:t.me/+AMHhMKEIj_IzN2Vl
✉️VIP Guidance : t.me/Jack_blackwell
면책사항
이 정보와 게시물은 TradingView에서 제공하거나 보증하는 금융, 투자, 거래 또는 기타 유형의 조언이나 권고 사항을 의미하거나 구성하지 않습니다. 자세한 내용은 이용 약관을 참고하세요.