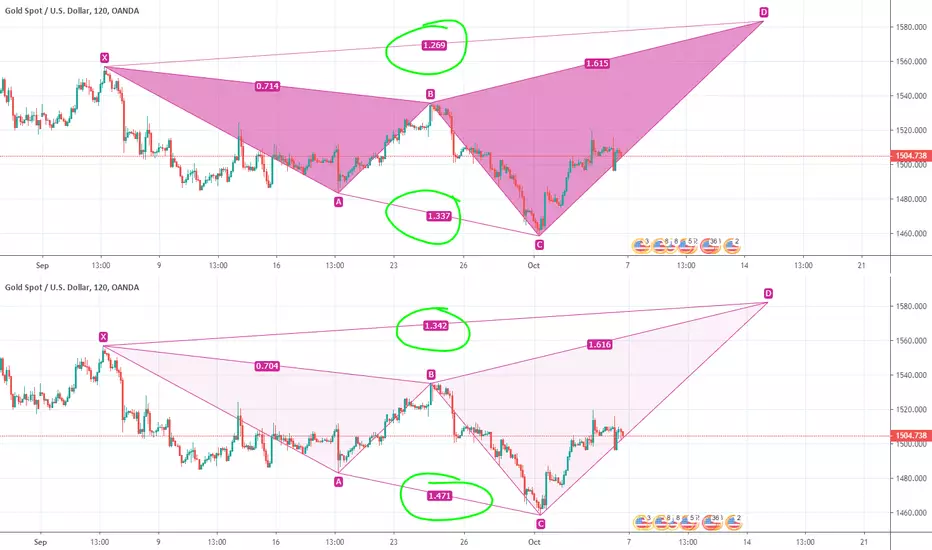
fortunately, I draw anti Gartley with cypher pattern tools that's why I could detect the anti Gartley pattern
when I try to draw with XABCD pattern tools I cannot see the same fib with my previous anti Gartley chart
I just realize that drawing with the XABCD pattern tool and Cypher pattern tool would bring different FIB results...
this is BIG mistake...
right now I confused with these 2 different tools right now...
which one do i need to use?
노트
tradingview.com/wiki/XABCD_Patterntradingview wiki
The XABCD Pattern drawing tool allows analysts to highlight various five point chart patterns. Users can manually draw and maneuver the five separate points (XABCD). The XABCD points create four separate legs which combine to form chart patterns. The four legs are referred to as XA, AB, BC, and CD.
Each of the five points (XABCD) represent a significant high or low in terms of price on the chart. Therefore, the four previously mentioned legs (XA, AB, BC, CD) represent different trends or price movements which move in opposite directions.
As a result there are four major XABCD chart patterns that are most common. These patterns can be either bullish or bearish.
The four major patterns include:
Gartley
Butterfly
Crab
Bat
노트
tradingview.com/education/cypherpattern/trading view cypher pattern page
The Cypher was discovered by Darren Oglesbee and though it is technically an advanced pattern formation, it is often associated with and traded alongside harmonic patterns. It has specific Fibonacci measurements for each point within its structure. The B point retracement of the primary XA leg lies between 0.382 and 0.618, the C point should be a 1.272 to 1.414 projection of the primary XA leg and the D point should be a 0.786 retracement of XC. The first target would be the 382 retracement of CD and the second target the 618 retracement of CD.
The stop would go beyond the next structure support / resistance beyond the X-point. Conservative traders may look for additional confirmation before entering a trade, for instance an aligning RSI value or a specific candlestick pointing at a reversal. The Cypher Pattern can be either bearish or bullish. TradingView has a smart Cypher Pattern drawing tool, created especially for this popular pattern. Please note that the ratio line between the A and C points represents how far C extended the XA leg. The ration line between the X and D points represents how far D retraced the XC leg.
노트
so... i ask Trading View support for helpand here the answer
"Those two patterns have differently calculated ratios. As for when you should use one and when another, it's up to you. I'd suggest you start by gathering info about harmonic trading ;)"
노트
guess I would use both tools for now until I adapted with 1 of the tool면책사항
해당 정보와 게시물은 금융, 투자, 트레이딩 또는 기타 유형의 조언이나 권장 사항으로 간주되지 않으며, 트레이딩뷰에서 제공하거나 보증하는 것이 아닙니다. 자세한 내용은 이용 약관을 참조하세요.
면책사항
해당 정보와 게시물은 금융, 투자, 트레이딩 또는 기타 유형의 조언이나 권장 사항으로 간주되지 않으며, 트레이딩뷰에서 제공하거나 보증하는 것이 아닙니다. 자세한 내용은 이용 약관을 참조하세요.