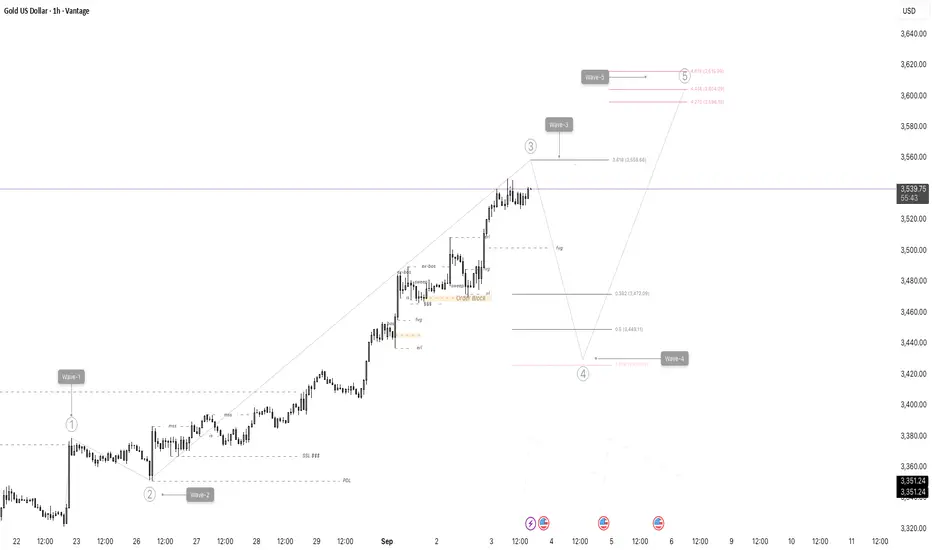
This trading plan combines Elliott Wave analysis with Fibonacci retracement and extension levels, focusing on key psychological points to guide entry, exit, and risk management decisions for the Gold/USD 1-hour chart.
Fibonacci Levels & Psychological Zones:
Wave 3 is approaching a Fibonacci extension zone near 3,558 - 3,616 (from 3.618 to 4.618 levels). This acts as a key resistance and potential Wave 3 target.
The retracement for Wave 4 correction is expected to land within the important Fibonacci retracement zones:
- 38.2% (~3,472)
- 50% (~3,449)
- 61.8% (~3,426)
These Fibonacci levels serve as psychological support zones where Wave 4 could end and Wave 5 might begin.
관련 발행물
면책사항
이 정보와 게시물은 TradingView에서 제공하거나 보증하는 금융, 투자, 거래 또는 기타 유형의 조언이나 권고 사항을 의미하거나 구성하지 않습니다. 자세한 내용은 이용 약관을 참고하세요.
면책사항
이 정보와 게시물은 TradingView에서 제공하거나 보증하는 금융, 투자, 거래 또는 기타 유형의 조언이나 권고 사항을 의미하거나 구성하지 않습니다. 자세한 내용은 이용 약관을 참고하세요.