While BTC slid, TeraWulf has climbed 43% over two weeks, showcasing exceptional relative strength.
This resilience signals robust underlying demand across the broader crypto-mining space and reinforces the upside momentum reflected in the Q-models.
Wave | Trend Analysis
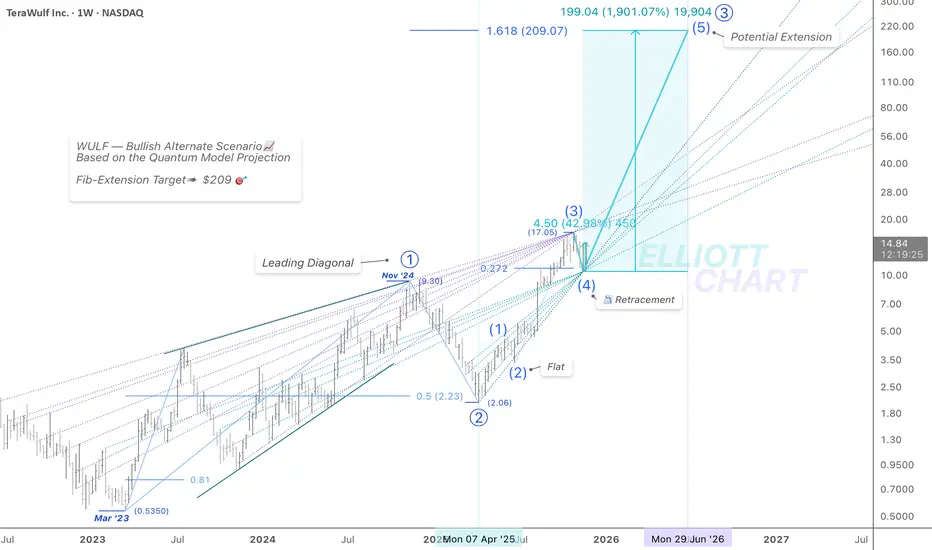
The correction in Intermediate Wave (4) reached the 0.272 Fibonacci retracement last week, culminating in a sharp pullback that paused precisely at the apex of the convergent support-equivalence lines.
As illustrated on the chart, the confluence areas where the extended equivalence lines converge may now serve as a high-probability support zone.
From this level, the model favours an extension into Intermediate Wave (5) within Primary Wave ⓷, projecting an impulsive advance toward ➤ $209 🎯 — a target that aligns with the 1.618 Fibonacci extension of the Leading Diagonal established in Primary Wave ⓵.
As noted earlier, the Leading Diagonal in Primary Wave ⓵ — originating in March 2023 — represents a potentially bullish structure, indicating an early-stage transition into a bullish accumulation phase. According to my framework, such motive patterns often precede strong impulsive advances, reinforcing the broader bullish narrative as the Cycle-degree Uptrend continues to unfold.
🔖 In my Quantum Models methodology, the equivalence lines function as structural elements, anchoring the model’s internal geometry and framing the progression of alternate paths.
#QuantumModels #EquivalenceLines #Targeting #MarketAnalysis #TechnicalAnalysis #ElliottWave #WaveAnalysis #TrendAnalysis #StocksToWatch #FibLevels #FinTwit #Investing #MiningStocks #CleanEnergy #SustainableMining #EnergyTech #TechStocks #Equities #DataCenters #BitcoinMining #CryptoMining #AIStocks #HPC #AI #BTC #Bitcoin #BTCUSD
면책사항
해당 정보와 게시물은 금융, 투자, 트레이딩 또는 기타 유형의 조언이나 권장 사항으로 간주되지 않으며, 트레이딩뷰에서 제공하거나 보증하는 것이 아닙니다. 자세한 내용은 이용 약관을 참조하세요.
면책사항
해당 정보와 게시물은 금융, 투자, 트레이딩 또는 기타 유형의 조언이나 권장 사항으로 간주되지 않으며, 트레이딩뷰에서 제공하거나 보증하는 것이 아닙니다. 자세한 내용은 이용 약관을 참조하세요.