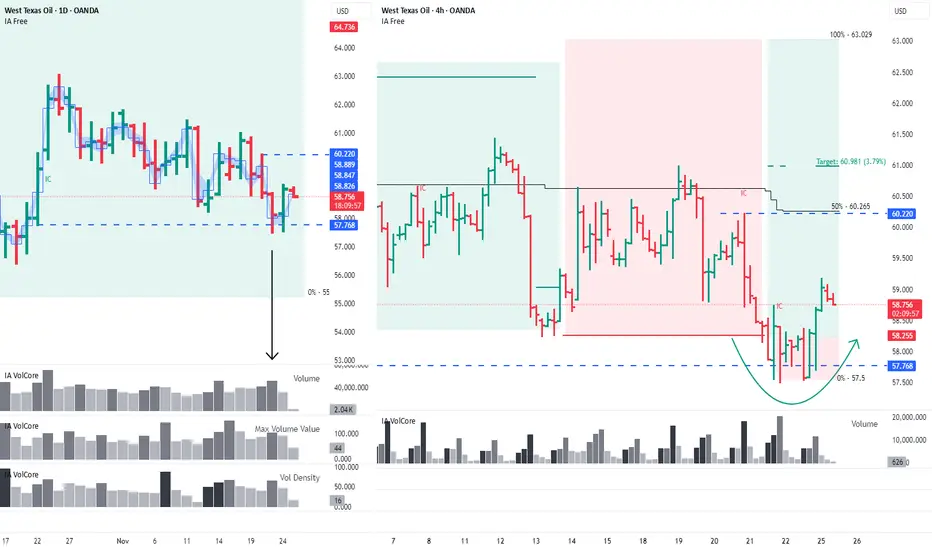
On the daily timeframe, buyers absorbed the sellers, and a false-breakout pattern has formed on the 4H chart. The nearest targets are 60.22 and 60.981.
This analysis is based on the Initiative Analysis (IA) method.
Hello, traders and investors!
Oil is showing early signs of recovery. On the daily timeframe, the key level is 57.768 — the base of a buyer candle with increased volume during the last upward impulse. A high-volume seller candle interacted with this level, and yesterday’s daily buyer candle absorbed the seller, indicating strengthening buyer initiative. It’s also worth noting that in both candles, the key volume was accumulated at the bottom.
The blue band on the chart represents the minimal price range of the candle where 50% of the volume was accumulated.
The blue line marks the price level with the maximum accumulated volume.
On the 4-hour timeframe, the price is in a sideways range. A false-breakout pattern has just formed at the lower boundary of this range. The nearest target is 60.22, which aligns with the 50% level of the trading range — an important point to monitor. The next target is 60.981.
Wishing you profitable trades!
Рыночные сценарии, инструкция к индикатору, практические примеры — t.me/ialogic
Market scenarios, indicator guide, practical examples — t.me/initiativeanalysis
Clarity on the Chart. Smart Trading Decisions
Market scenarios, indicator guide, practical examples — t.me/initiativeanalysis
Clarity on the Chart. Smart Trading Decisions
면책사항
해당 정보와 게시물은 금융, 투자, 트레이딩 또는 기타 유형의 조언이나 권장 사항으로 간주되지 않으며, 트레이딩뷰에서 제공하거나 보증하는 것이 아닙니다. 자세한 내용은 이용 약관을 참조하세요.