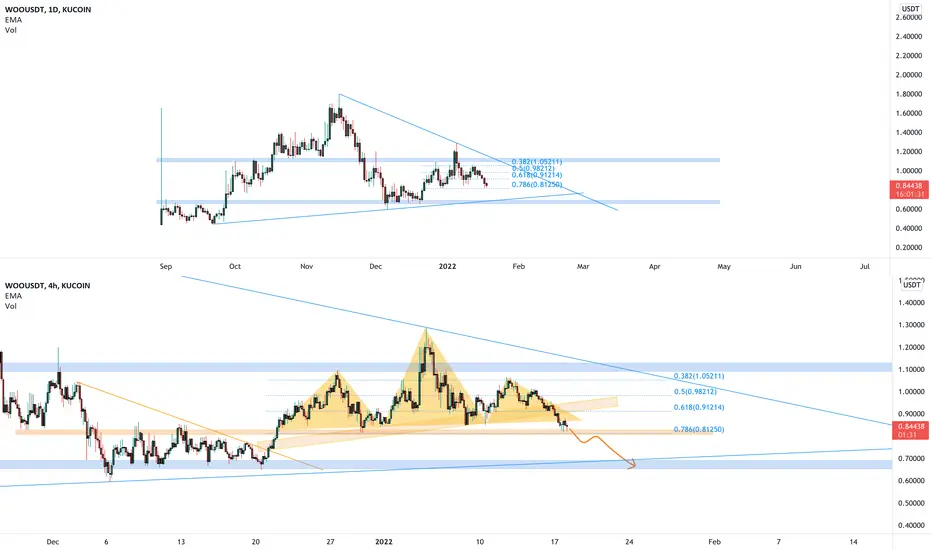
The price is creating a head and shoulders pattern on 4h timeframe and now the price is testing its neckline on the 0.786 Fibonacci level.
If the price is going to lose the support (0.81$) we could see a more continuation to the downside until the 0.7$
Of course, it's not enough to have just a breakout, you need to follow your strategy, for that reason we are following Plancton's rules.
––––
Keep in mind.
🟣 Purple structure -> Monthly structure.
🔴 Red structure -> Weekly structure.
🔵 Blue structure -> Daily structure.
🟡 Yellow structure -> 4h structure.
노트
The price created a huge head and shoulders on 4h timeframe and after the breakdown, we got a 7%.노트
The price had a breakout from the neckline and retested as new resistance.
As I said, we could see a continuation to the downside until 0.7$
노트
Head and shoulders worked!the price had a breakout triggered our strategies and we made more than 42%
노트
The price is creating a pennant below the daily resistance.
We could see a continuation if the price is going to have a new bearish breakout.
Amazing profit from our FREE CALL
노트
After the head and shoulders, the price created a pennant.If the price is going to have another breakdown from the support, we could see another bearish impulse
42% since my free signal! 👍
노트
The price is following my drawing, after a head and shoulders the price retested its neckline on 0.5 and had a bearish impulse where our students made more than 42%The price created the pennant and had a breakout and retest the previous dynamic support as new resistance.
The market is testing the 0.5 as new support, If the price is going to have a breakdown we could see a new leg down.
면책사항
이 정보와 게시물은 TradingView에서 제공하거나 보증하는 금융, 투자, 거래 또는 기타 유형의 조언이나 권고 사항을 의미하거나 구성하지 않습니다. 자세한 내용은 이용 약관을 참고하세요.
면책사항
이 정보와 게시물은 TradingView에서 제공하거나 보증하는 금융, 투자, 거래 또는 기타 유형의 조언이나 권고 사항을 의미하거나 구성하지 않습니다. 자세한 내용은 이용 약관을 참고하세요.