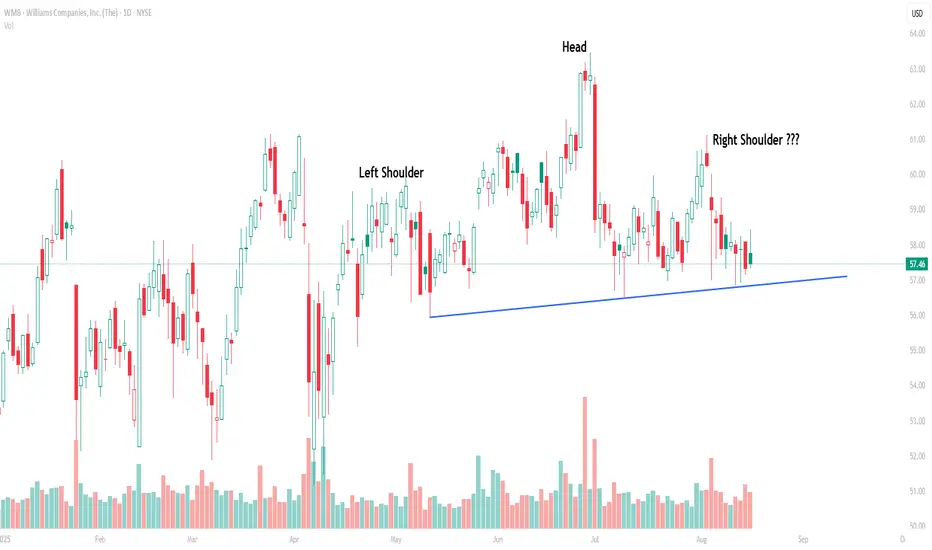
Key Note: Let’s keep it straight — until the neckline breaks, this remains a potential Head
& Shoulders (H&S), not a confirmed one. A close below $56.5 on strong volume would
be the real confirmation trigger.
Currently, WMB is sketching what looks like a bearish Head & Shoulders pattern. The
left shoulder was formed in April near $60, the head at the June peak around $63 and the
right shoulder is emerging with the recent rally stalling back at $60. The neckline aligns
with the rising trendline support around $57, which has been repeatedly tested.
If the neckline gives way, the breakdown completes the bearish setup, with a measured
downside projection of roughly $50, based on the head-to-neckline height. Until then,
this remains just a developing structure rather than a done deal.
Sharing indicator studies & global setups | twitter.com/gautam_icma
면책사항
이 정보와 게시물은 TradingView에서 제공하거나 보증하는 금융, 투자, 거래 또는 기타 유형의 조언이나 권고 사항을 의미하거나 구성하지 않습니다. 자세한 내용은 이용 약관을 참고하세요.
Sharing indicator studies & global setups | twitter.com/gautam_icma
면책사항
이 정보와 게시물은 TradingView에서 제공하거나 보증하는 금융, 투자, 거래 또는 기타 유형의 조언이나 권고 사항을 의미하거나 구성하지 않습니다. 자세한 내용은 이용 약관을 참고하세요.
