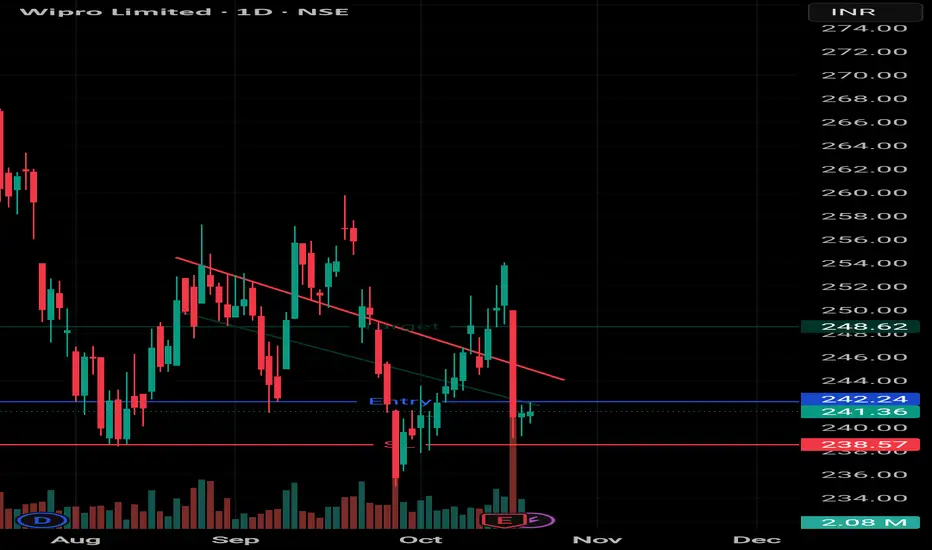
The latest price chart highlights a Falling Wedge pattern, a classic bullish formation that often signals the downtrend is losing strength and a breakout to the upside could be near. The stock has been consolidating within the wedge, and a breakout above the resistance line could confirm a strong upward move.
면책사항
이 정보와 게시물은 TradingView에서 제공하거나 보증하는 금융, 투자, 거래 또는 기타 유형의 조언이나 권고 사항을 의미하거나 구성하지 않습니다. 자세한 내용은 이용 약관을 참고하세요.
면책사항
이 정보와 게시물은 TradingView에서 제공하거나 보증하는 금융, 투자, 거래 또는 기타 유형의 조언이나 권고 사항을 의미하거나 구성하지 않습니다. 자세한 내용은 이용 약관을 참고하세요.