WIPRO LTD.
Wave Structure:
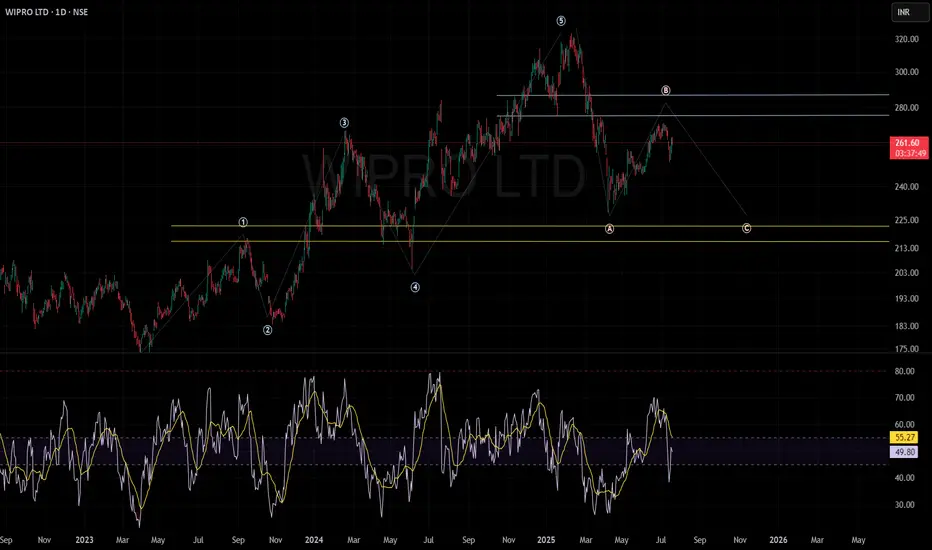
The chart depicts a well-defined Elliott Wave pattern, illustrating a completed five-wave impulse sequence succeeded by a classic ABC corrective phase.
Wave B retracement appears to be underway, with resistance anticipated around the ₹275–₹285 zone.
Support & Resistance:
Key resistance levels are established at ₹275–₹285, which historically coincided with selling pressure and reversal zones.
Major support zones are highlighted between ₹210–₹225, a region with repeated buying interest and robust price recovery in the past.
Technical Outlook:
The current price structure suggests continued corrective bias, with a probable move towards the lower support band (₹210–₹225), barring any decisive reversal above the key resistance.
Unless momentum breaks out above ₹285 with conviction, the base scenario remains cautious to bearish.
My analysis is anchored in classical price action and Elliott Wave theory to identify potential market inflection points.
Sentiment:
The prevailing market sentiment remains neutral to negative as the price fails to breach significant resistance and is trading below the Wave B peak.
A shift in momentum can only be confirmed if there is sustained price action above resistance with increased volume.
Disclaimer:
This analysis is strictly for educational and informational purposes, not intended as trading or investment advice.
Wave Structure:
The chart depicts a well-defined Elliott Wave pattern, illustrating a completed five-wave impulse sequence succeeded by a classic ABC corrective phase.
Wave B retracement appears to be underway, with resistance anticipated around the ₹275–₹285 zone.
Support & Resistance:
Key resistance levels are established at ₹275–₹285, which historically coincided with selling pressure and reversal zones.
Major support zones are highlighted between ₹210–₹225, a region with repeated buying interest and robust price recovery in the past.
Technical Outlook:
The current price structure suggests continued corrective bias, with a probable move towards the lower support band (₹210–₹225), barring any decisive reversal above the key resistance.
Unless momentum breaks out above ₹285 with conviction, the base scenario remains cautious to bearish.
My analysis is anchored in classical price action and Elliott Wave theory to identify potential market inflection points.
Sentiment:
The prevailing market sentiment remains neutral to negative as the price fails to breach significant resistance and is trading below the Wave B peak.
A shift in momentum can only be confirmed if there is sustained price action above resistance with increased volume.
Disclaimer:
This analysis is strictly for educational and informational purposes, not intended as trading or investment advice.
면책사항
이 정보와 게시물은 TradingView에서 제공하거나 보증하는 금융, 투자, 거래 또는 기타 유형의 조언이나 권고 사항을 의미하거나 구성하지 않습니다. 자세한 내용은 이용 약관을 참고하세요.
면책사항
이 정보와 게시물은 TradingView에서 제공하거나 보증하는 금융, 투자, 거래 또는 기타 유형의 조언이나 권고 사항을 의미하거나 구성하지 않습니다. 자세한 내용은 이용 약관을 참고하세요.