**📊 Technical Analysis**
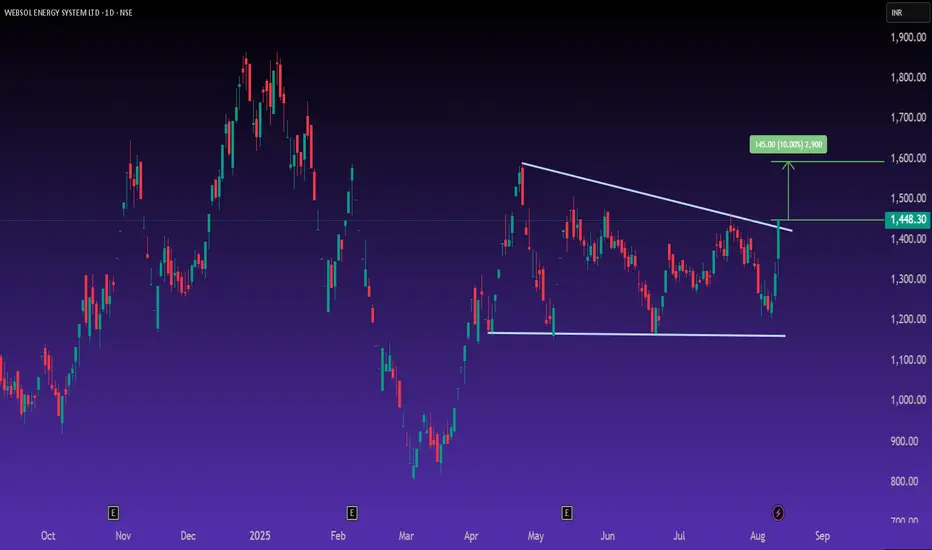
Websol Energy has given a strong breakout from a descending triangle formation on the daily chart, backed by a 9.99% upper circuit close at ₹1,448. The breakout confirms renewed buying interest, with an immediate pattern target of around ₹1,590–₹1,600 (≈10% upside).
Support is now placed near ₹1,400, with stronger support at ₹1,250 in case of deeper pullbacks. The price action shows rising momentum, suggesting potential continuation if volumes stay elevated.
**📈 Fundamental Analysis – Q1 FY26 (Jun 2025) Results**
The company delivered exceptional YoY growth:
* **Sales:** ₹219 Cr — up **96% YoY**
* **EBIDT:** ₹103 Cr — up **135% YoY**
* **Net Profit:** ₹67.2 Cr — up **194% YoY**
* **EPS:** ₹15.47 vs ₹5.42 last year — **185% growth**
* **Valuation:** PE \~31.6, reflecting strong growth expectations in the renewable energy space.
This surge in profitability and margins underlines operational efficiency and strong demand in the solar sector, potentially positioning Websol as a key beneficiary of India’s renewable energy push.
**💡 Conclusion**
With a bullish chart breakout aligning with stellar earnings growth, Websol Energy appears poised for further upside toward ₹1,600 in the short term. Long-term prospects remain promising, given the sector tailwinds and earnings momentum.
**Disclaimer:** Educational purpose only. Not investment advice.
면책사항
해당 정보와 게시물은 금융, 투자, 트레이딩 또는 기타 유형의 조언이나 권장 사항으로 간주되지 않으며, 트레이딩뷰에서 제공하거나 보증하는 것이 아닙니다. 자세한 내용은 이용 약관을 참조하세요.
면책사항
해당 정보와 게시물은 금융, 투자, 트레이딩 또는 기타 유형의 조언이나 권장 사항으로 간주되지 않으며, 트레이딩뷰에서 제공하거나 보증하는 것이 아닙니다. 자세한 내용은 이용 약관을 참조하세요.