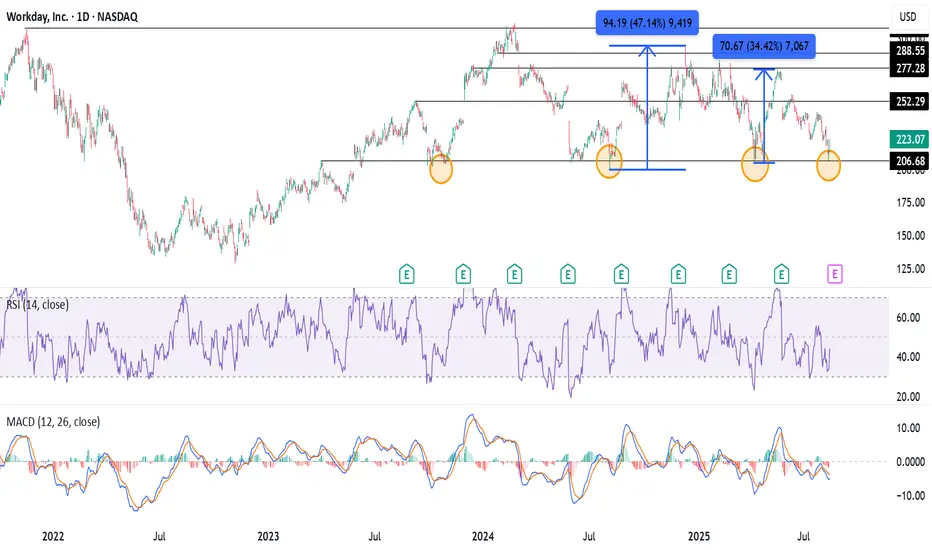
The first time WDAY crossed $300 was way back in November 2021, when the bullish trend, which started after the 2020 fall, made the stock rise almost 200%. The stock retested its ATH and managed to create a new ATH just above $311 in February 2024, but failed to sustain above it.
Since then, the stock has corrected and tested $200 multiple times in August 2024, April 2025, and now in August 2025. The $200 seems to be a strong support base. On previous occasions, when the price tested $200, the stock rose ~47% from August to December 2024 and ~34% in April-May 2025.
The price has now once again retested its strong support base around $200, with a low of $206.77, followed by a pin-bar day candlestick on August 12. The bulls seem to have come at the right time, as the price rose 3.95% on the following session.
The support base $200 with a pin-bar candle followed by a bullish momentum on the next day sets the perfect long setup for the trade.
Potential Swing Targets- $250-252, $275-277, and $288-290.
Stop-loss around $200-198.
면책사항
이 정보와 게시물은 TradingView에서 제공하거나 보증하는 금융, 투자, 거래 또는 기타 유형의 조언이나 권고 사항을 의미하거나 구성하지 않습니다. 자세한 내용은 이용 약관을 참고하세요.
면책사항
이 정보와 게시물은 TradingView에서 제공하거나 보증하는 금융, 투자, 거래 또는 기타 유형의 조언이나 권고 사항을 의미하거나 구성하지 않습니다. 자세한 내용은 이용 약관을 참고하세요.