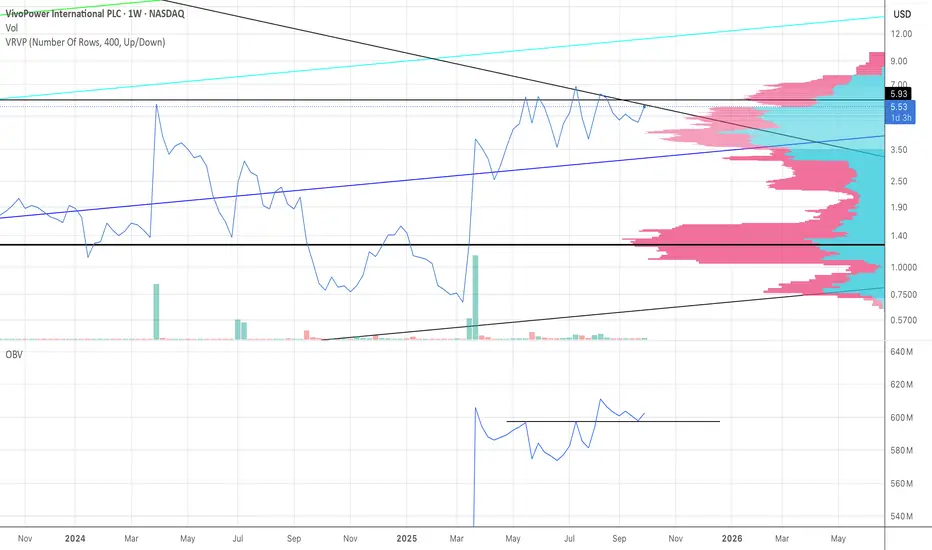
Here, we have the price (in line) smashing up against a descending overhead from early in the chart. Also, we're at the upper edges of the Volume Profile. Even though I don't have the whole chart history on the page, it doesn't matter because I have the part that has the volume, as you can see in that first green candle. That's when the chart "came to life". So, since volume has entered the ticker, we're at the upper edges of the price and the volume profile. A break out from here will be catastrophic for the bears, because the move will be larger than most anticipate.
면책사항
해당 정보와 게시물은 금융, 투자, 트레이딩 또는 기타 유형의 조언이나 권장 사항으로 간주되지 않으며, 트레이딩뷰에서 제공하거나 보증하는 것이 아닙니다. 자세한 내용은 이용 약관을 참조하세요.
면책사항
해당 정보와 게시물은 금융, 투자, 트레이딩 또는 기타 유형의 조언이나 권장 사항으로 간주되지 않으며, 트레이딩뷰에서 제공하거나 보증하는 것이 아닙니다. 자세한 내용은 이용 약관을 참조하세요.