Technical Analysis & Breakout Potential –  VNET
VNET
1. Technical indicators show a "Strong Buy"
According to TipRanks, VNET scores strongly across several technical indicators such as RSI, MACD, and multiple moving averages—all signals point toward buy recommendations Investing.com also concludes with a “Strong Buy” sentiment across short, medium, and long term
2. Positive fundamental trigger: high revenue growth while maintaining guidance
VNET grew revenue by 22.1% year-over-year, and EBITDA rose 27.7%—while EPS disappointed. However, 2025 full-year guidance remains solid at 9.15 to 9.35 billion yuan, showing confidence in operational strength .
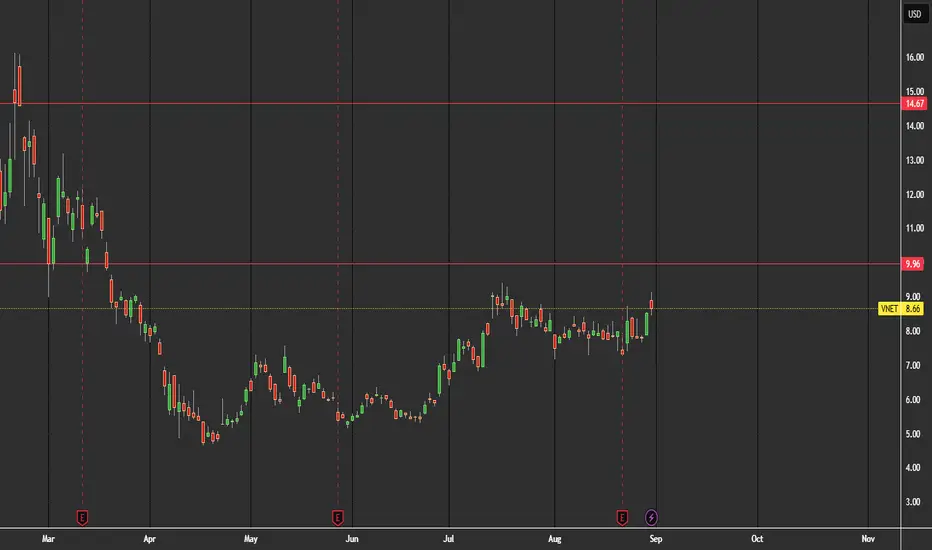
3. Technical price action and resistance zone
Today’s intraday high is around $9.25—just below $9.35. Barchart identifies resistance levels at R2: $8.98 and R3: $9.42 The stock is clearly approaching this breakout zone and confirms technical strength across higher moving averages such as MA20, MA50, MA100, and MA200
4. Volatility & outlook
VNET shows above-average volatility (~12% weekly) compared to the tech sector (~8.4%). For momentum strategies, however, this can drive rapid upside—especially during a technical breakout.
Verdict & Recommendation
Breakout level: $9.35 – a strong resistance level. A close above this would be a clear bullish trigger.
Upside potential: Breakout toward $9.42 – and possibly further toward $11+ based on analyst targets (avg. $11.20 → ~+29%)
Strong momentum: Supported by technical indicators and revenue growth; a solid risk/reward case.
Caution: High volatility means sharp moves in both directions — stop-loss management is essential.
1. Technical indicators show a "Strong Buy"
According to TipRanks, VNET scores strongly across several technical indicators such as RSI, MACD, and multiple moving averages—all signals point toward buy recommendations Investing.com also concludes with a “Strong Buy” sentiment across short, medium, and long term
2. Positive fundamental trigger: high revenue growth while maintaining guidance
VNET grew revenue by 22.1% year-over-year, and EBITDA rose 27.7%—while EPS disappointed. However, 2025 full-year guidance remains solid at 9.15 to 9.35 billion yuan, showing confidence in operational strength .
3. Technical price action and resistance zone
Today’s intraday high is around $9.25—just below $9.35. Barchart identifies resistance levels at R2: $8.98 and R3: $9.42 The stock is clearly approaching this breakout zone and confirms technical strength across higher moving averages such as MA20, MA50, MA100, and MA200
4. Volatility & outlook
VNET shows above-average volatility (~12% weekly) compared to the tech sector (~8.4%). For momentum strategies, however, this can drive rapid upside—especially during a technical breakout.
Verdict & Recommendation
Breakout level: $9.35 – a strong resistance level. A close above this would be a clear bullish trigger.
Upside potential: Breakout toward $9.42 – and possibly further toward $11+ based on analyst targets (avg. $11.20 → ~+29%)
Strong momentum: Supported by technical indicators and revenue growth; a solid risk/reward case.
Caution: High volatility means sharp moves in both directions — stop-loss management is essential.
면책사항
해당 정보와 게시물은 금융, 투자, 트레이딩 또는 기타 유형의 조언이나 권장 사항으로 간주되지 않으며, 트레이딩뷰에서 제공하거나 보증하는 것이 아닙니다. 자세한 내용은 이용 약관을 참조하세요.
면책사항
해당 정보와 게시물은 금융, 투자, 트레이딩 또는 기타 유형의 조언이나 권장 사항으로 간주되지 않으며, 트레이딩뷰에서 제공하거나 보증하는 것이 아닙니다. 자세한 내용은 이용 약관을 참조하세요.