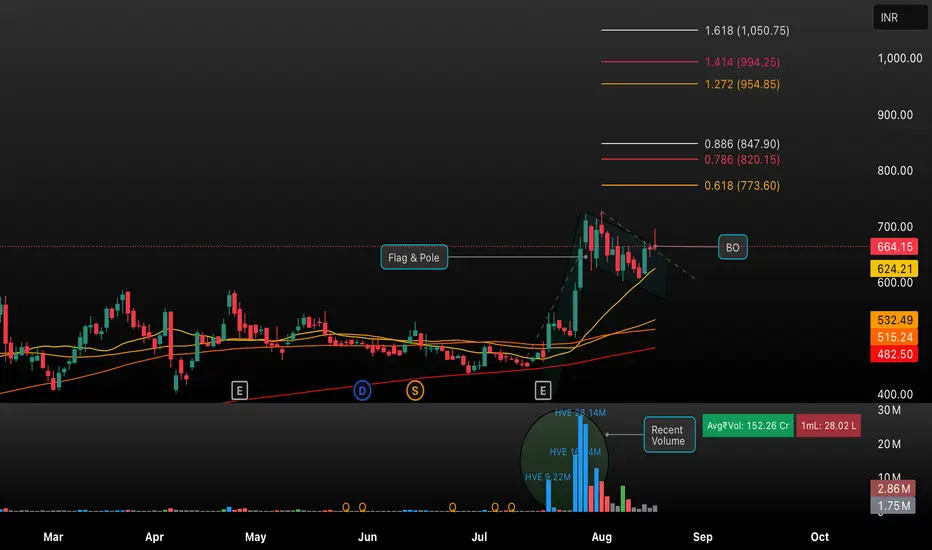
Vimta Labs has just triggered a textbook breakout from its classic Flag & Pole pattern, supported by surging volumes and strong momentum indicators. After a sustained consolidation, price action has decisively moved above the resistance line, confirming a bullish continuation with potential targets at key Fibonacci extensions (773, 820, 847, 954, 994, and 1,050 INR).
Daily, weekly, and monthly RSI show increasing strength, and price trades above all major moving averages, reinforcing the bullish setup. Watch for follow-through towards ₹800 and ₹890, with stop-loss suggested near ₹625 to manage risk.
This setup is ideal for traders looking to ride trend continuation post-breakout. Will Vimta Labs reach new highs? Share your views and trading plans below!
액티브 트레이드
Fib ratio .618 tested면책사항
이 정보와 게시물은 TradingView에서 제공하거나 보증하는 금융, 투자, 거래 또는 기타 유형의 조언이나 권고 사항을 의미하거나 구성하지 않습니다. 자세한 내용은 이용 약관을 참고하세요.
면책사항
이 정보와 게시물은 TradingView에서 제공하거나 보증하는 금융, 투자, 거래 또는 기타 유형의 조언이나 권고 사항을 의미하거나 구성하지 않습니다. 자세한 내용은 이용 약관을 참고하세요.