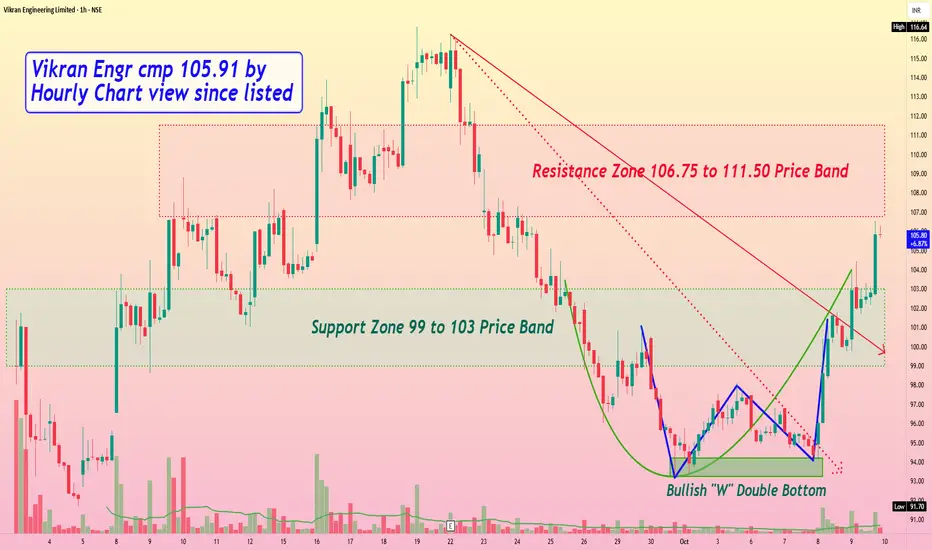
Vikran Engineering cmp 105.91 by Hourly Chart view since listed
- Support Zone 99 to 103 Price Band
- Resistance Zone 106.75 to 111.50 Price Band
- Volumes are spiking well above avg traded quantity over past few days
- Subject to closure above Resistance Zone for few days, New ATH maybe anticipated
- Stock has formed bullish technical chart setup with Rounding Bottom and W Double Bottom
면책사항
해당 정보와 게시물은 금융, 투자, 트레이딩 또는 기타 유형의 조언이나 권장 사항으로 간주되지 않으며, 트레이딩뷰에서 제공하거나 보증하는 것이 아닙니다. 자세한 내용은 이용 약관을 참조하세요.
면책사항
해당 정보와 게시물은 금융, 투자, 트레이딩 또는 기타 유형의 조언이나 권장 사항으로 간주되지 않으며, 트레이딩뷰에서 제공하거나 보증하는 것이 아닙니다. 자세한 내용은 이용 약관을 참조하세요.