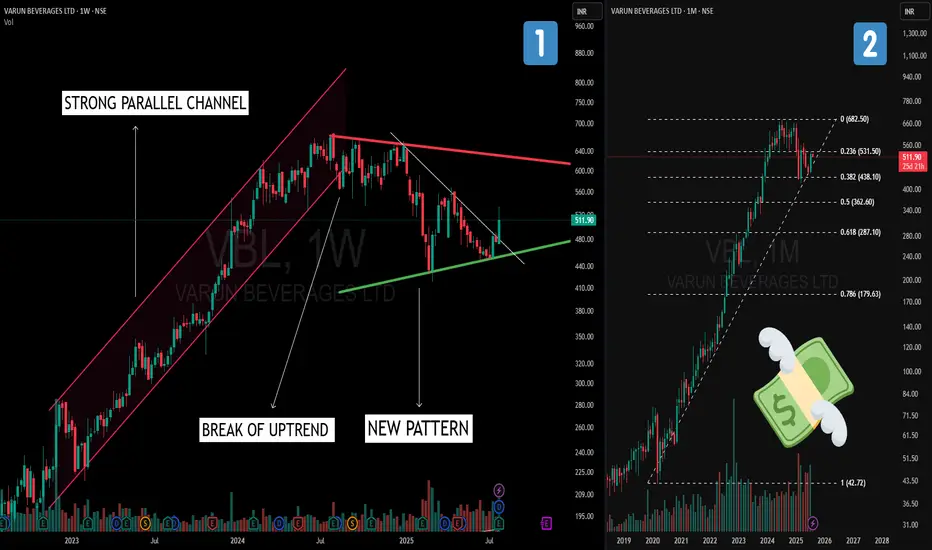
On the monthly timeframe (right chart), Varun Beverages shows a classic Fibonacci retracement pullback to the 38.2% level after an extended rally.
>Shifting to the weekly timeframe (left chart), we observe:
-Parallel Channel during the earlier uptrend phase, reflecting a strong trending structure.
-A break of the uptrend that transitioned into a sideways phase.
-Formation of a Symmetrical Triangle – characterized by a sequence of lower highs and higher lows, creating a contraction pattern.
This multi‑timeframe view highlights how trends evolve from strong rallies, to corrections, and into consolidation structures.
⚠️ Disclaimer:
This post is for educational purposes only and is not financial advice.
🎯 Master My Self-Made Trading Strategy
📈 Telegram (Learn Today): t.me/hashtaghammer
✅ WhatsApp (Learn Today): wa.me/919455664601
📈 Telegram (Learn Today): t.me/hashtaghammer
✅ WhatsApp (Learn Today): wa.me/919455664601
관련 발행물
면책사항
해당 정보와 게시물은 금융, 투자, 트레이딩 또는 기타 유형의 조언이나 권장 사항으로 간주되지 않으며, 트레이딩뷰에서 제공하거나 보증하는 것이 아닙니다. 자세한 내용은 이용 약관을 참조하세요.