📊 VARROC – 1-Week (Current) Key Levels to Watch
1. Current Price
a) According to EtMoney, VARROC is around ₹ 652.45.
b) On Investing.com, the weekly technical summary is Strong Buy.
2. Support Levels (Weekly / Key Zones)
a) ~ ₹ 630–635: This zone emerges as a support area (near some pivot and past price congestion).
b) From Research360: support seen at ₹ 600.63 and then ₹ 593.82.
c) On 5paisa pivots: S1 around ₹ 622.23.
3. Resistance / Important Levels
a) ₹ 654–660: According to Investing.com’s pivot table, a pivot is at ₹ 645.3, with R1 = ₹ 654, R2 = ₹ 658.35, R3 = ₹ 667.05.
b) From Torus Digital pivot points: R1 ~ ₹ 656.37, R2 ~ ₹ 671.88.
c) On weekly chart (TradingView ideas): there’s a neckline around ~₹ 637.7 for a potential inverse head & shoulders.
4. Oscillators / Momentum
a) Weekly RSI (Moneycontrol) is ~ 63.23 — suggests bullish strength but not extremely overbought.
b) On EtMoney, short-term oscillators (daily) are showing strong uptrend (CCI is very high, MFI bullish).
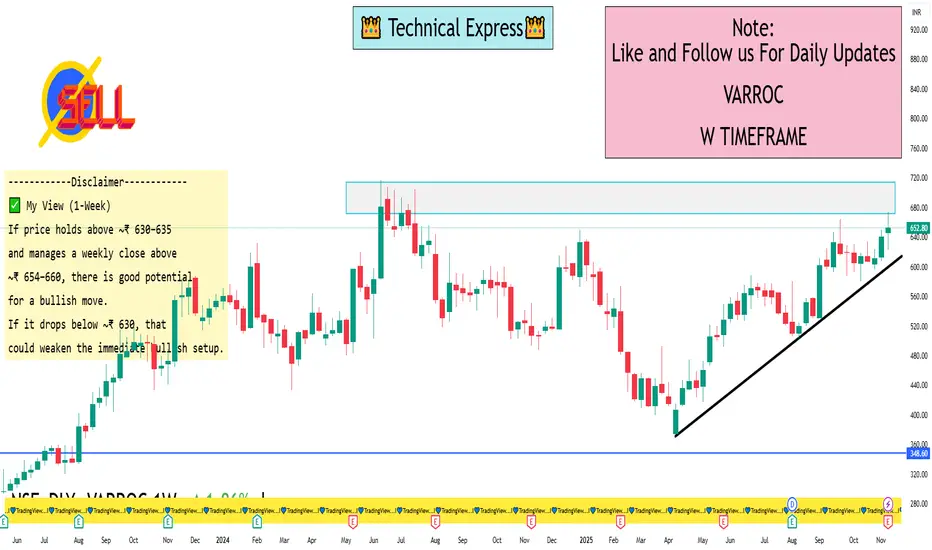
✅ My View (1-Week)
If price holds above ~₹ 630–635 and manages a weekly close above ~₹ 654–660, there is good potential for a bullish move.
If it drops below ~₹ 630, that could weaken the immediate bullish setup.
Given strong weekly technicals (moving averages + momentum), the bias is mildly bullish, but confirmation at the higher resistance is important.
1. Current Price
a) According to EtMoney, VARROC is around ₹ 652.45.
b) On Investing.com, the weekly technical summary is Strong Buy.
2. Support Levels (Weekly / Key Zones)
a) ~ ₹ 630–635: This zone emerges as a support area (near some pivot and past price congestion).
b) From Research360: support seen at ₹ 600.63 and then ₹ 593.82.
c) On 5paisa pivots: S1 around ₹ 622.23.
3. Resistance / Important Levels
a) ₹ 654–660: According to Investing.com’s pivot table, a pivot is at ₹ 645.3, with R1 = ₹ 654, R2 = ₹ 658.35, R3 = ₹ 667.05.
b) From Torus Digital pivot points: R1 ~ ₹ 656.37, R2 ~ ₹ 671.88.
c) On weekly chart (TradingView ideas): there’s a neckline around ~₹ 637.7 for a potential inverse head & shoulders.
4. Oscillators / Momentum
a) Weekly RSI (Moneycontrol) is ~ 63.23 — suggests bullish strength but not extremely overbought.
b) On EtMoney, short-term oscillators (daily) are showing strong uptrend (CCI is very high, MFI bullish).
✅ My View (1-Week)
If price holds above ~₹ 630–635 and manages a weekly close above ~₹ 654–660, there is good potential for a bullish move.
If it drops below ~₹ 630, that could weaken the immediate bullish setup.
Given strong weekly technicals (moving averages + momentum), the bias is mildly bullish, but confirmation at the higher resistance is important.
I built a Buy & Sell Signal Indicator with 85% accuracy.
📈 Get access via DM or
WhatsApp: wa.link/d997q0
Contact - +91 76782 40962
| Email: techncialexpress@gmail.com
| Script Coder | Trader | Investor | From India
📈 Get access via DM or
WhatsApp: wa.link/d997q0
Contact - +91 76782 40962
| Email: techncialexpress@gmail.com
| Script Coder | Trader | Investor | From India
관련 발행물
면책사항
해당 정보와 게시물은 금융, 투자, 트레이딩 또는 기타 유형의 조언이나 권장 사항으로 간주되지 않으며, 트레이딩뷰에서 제공하거나 보증하는 것이 아닙니다. 자세한 내용은 이용 약관을 참조하세요.