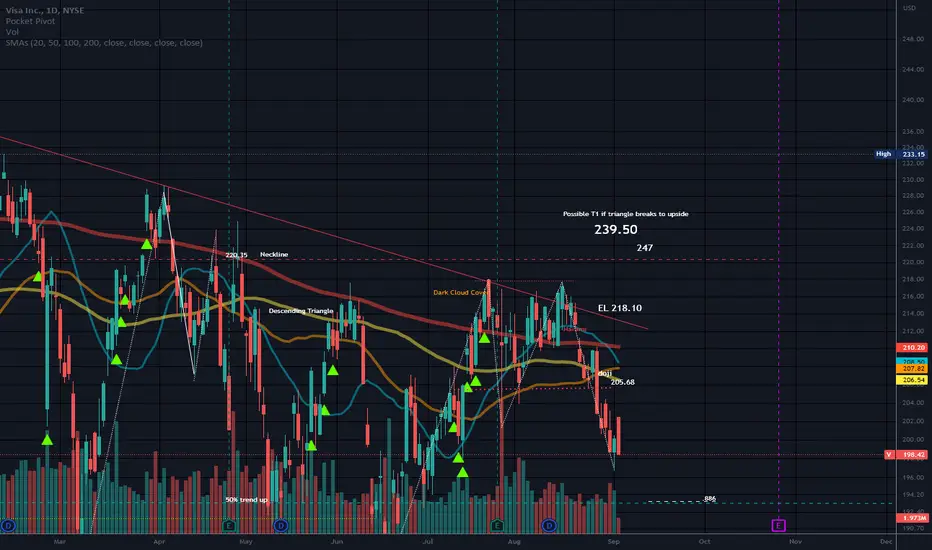
Price appears to be in a large Descending Triangle.
Neutral pattern until a trendline is broken.
Prior Head and Shoulders pattern.
Targets in orange below price are for a break of support of the triangle.
There is a Double bottom at the support line of the triangle.
Possible M structure forming. It is too early to tell.
Gaps noted below support line.
Price is still above the 50% level of the trend up measured from the Flu low.
No recommendation.
MA's chart is similar.
면책사항
이 정보와 게시물은 TradingView에서 제공하거나 보증하는 금융, 투자, 거래 또는 기타 유형의 조언이나 권고 사항을 의미하거나 구성하지 않습니다. 자세한 내용은 이용 약관을 참고하세요.
면책사항
이 정보와 게시물은 TradingView에서 제공하거나 보증하는 금융, 투자, 거래 또는 기타 유형의 조언이나 권고 사항을 의미하거나 구성하지 않습니다. 자세한 내용은 이용 약관을 참고하세요.