# Visa Inc. (V) – Daily Chart Deep Dive
## 1. Price Structure & Trend Pattern
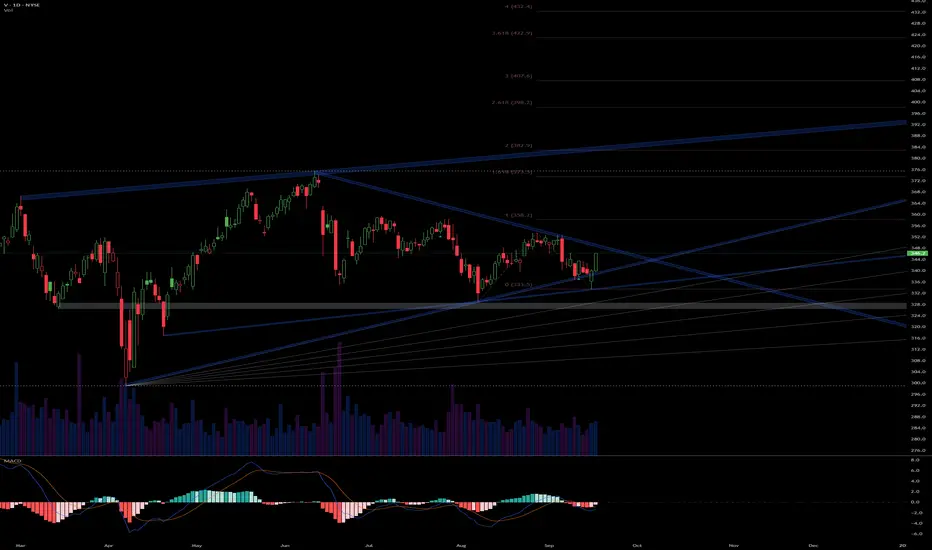
- The daily candles from April through mid-September trace a classic descending triangle: a series of lower highs feeding off the upper trendline, while horizontal support around 351.13 holds repeatedly.
- A descending triangle often signals distribution—supply overwhelming demand—but it can also form late in a broader uptrend as a bullish continuation pattern. Context is key: Visa’s multi-year uptrend remains intact above 280, so this consolidation could be a re-accumulation phase.
## 2. Volume Analysis
- Volume has steadily contracted as the triangle has narrowed, indicating lower conviction from both buyers and sellers—a hallmark of both continued consolidation or a Coiling Wyckoff re-accumulation.
- Look for a volume spike above the 20-day average on any breakout (up or down) to validate the move. A high-volume break below 351.13 would mark a Sign of Weakness (SOW), while a high-volume break above 359.73–370.61 would represent a Sign of Strength (SOS).
## 3. Momentum (MACD)
- The MACD lines are converging just below zero, and the histogram shows a slight bullish divergence: price making a marginally lower low near support while momentum holds flat or ticks higher.
- A bullish MACD cross here would reinforce a breakout scenario, especially if momentum turns positive and climbs above the zero-line.
## 4. Key Price Levels
| Price Level | Role |
|------------:|-----------------------------------|
| 370.61 | Upper trendline resistance |
| 359.73 | Near-term pivot resistance zone |
| 351.13 | Horizontal support (triangle base)|
| 337.12 | Secondary support zone |
## 5. Wyckoff Phase Mapping
- This structure most resembles a **Re-Accumulation**:
• **Preliminary Support (PS):** Multiple tests of 351.13 with waning volume.
• **Selling Climax (SC) & Automatic Rally (AR):** The swing from 337.12 up to ~370 formed the AR, then secondary tests near SC.
• **Secondary Test (ST):** Recent touches of support with lower volume.
• **Coiling:** The narrowing price range and lower volume prepare for a final breakout (Upthrust or Spring).
## 1. Price Structure & Trend Pattern
- The daily candles from April through mid-September trace a classic descending triangle: a series of lower highs feeding off the upper trendline, while horizontal support around 351.13 holds repeatedly.
- A descending triangle often signals distribution—supply overwhelming demand—but it can also form late in a broader uptrend as a bullish continuation pattern. Context is key: Visa’s multi-year uptrend remains intact above 280, so this consolidation could be a re-accumulation phase.
## 2. Volume Analysis
- Volume has steadily contracted as the triangle has narrowed, indicating lower conviction from both buyers and sellers—a hallmark of both continued consolidation or a Coiling Wyckoff re-accumulation.
- Look for a volume spike above the 20-day average on any breakout (up or down) to validate the move. A high-volume break below 351.13 would mark a Sign of Weakness (SOW), while a high-volume break above 359.73–370.61 would represent a Sign of Strength (SOS).
## 3. Momentum (MACD)
- The MACD lines are converging just below zero, and the histogram shows a slight bullish divergence: price making a marginally lower low near support while momentum holds flat or ticks higher.
- A bullish MACD cross here would reinforce a breakout scenario, especially if momentum turns positive and climbs above the zero-line.
## 4. Key Price Levels
| Price Level | Role |
|------------:|-----------------------------------|
| 370.61 | Upper trendline resistance |
| 359.73 | Near-term pivot resistance zone |
| 351.13 | Horizontal support (triangle base)|
| 337.12 | Secondary support zone |
## 5. Wyckoff Phase Mapping
- This structure most resembles a **Re-Accumulation**:
• **Preliminary Support (PS):** Multiple tests of 351.13 with waning volume.
• **Selling Climax (SC) & Automatic Rally (AR):** The swing from 337.12 up to ~370 formed the AR, then secondary tests near SC.
• **Secondary Test (ST):** Recent touches of support with lower volume.
• **Coiling:** The narrowing price range and lower volume prepare for a final breakout (Upthrust or Spring).
관련 발행물
면책사항
이 정보와 게시물은 TradingView에서 제공하거나 보증하는 금융, 투자, 거래 또는 기타 유형의 조언이나 권고 사항을 의미하거나 구성하지 않습니다. 자세한 내용은 이용 약관을 참고하세요.
면책사항
이 정보와 게시물은 TradingView에서 제공하거나 보증하는 금융, 투자, 거래 또는 기타 유형의 조언이나 권고 사항을 의미하거나 구성하지 않습니다. 자세한 내용은 이용 약관을 참고하세요.