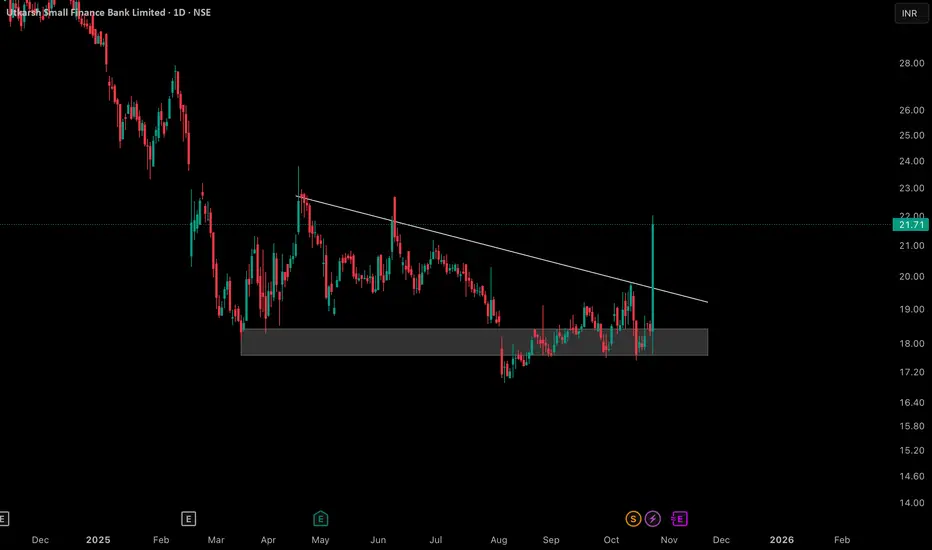
The daily chart for Utkarsh Small Finance Bank Limited displays a well-defined descending triangle, marked by a consistent supply trendline and an established horizontal support zone. During the recent price action, there was a temporary dip below the support, which was quickly retraced as price action returned within the range and formed a distinct lower wick rejection candle at the base.
This chart highlights the role of false moves and re-entries within important technical zones, as well as the reaction to a descending trendline. No trading advice or forecast is implied—this is for educational and analytical purposes, providing an example of how certain classical patterns and market behaviors may unfold within price structure.
This chart highlights the role of false moves and re-entries within important technical zones, as well as the reaction to a descending trendline. No trading advice or forecast is implied—this is for educational and analytical purposes, providing an example of how certain classical patterns and market behaviors may unfold within price structure.
🎯 Master My Self-Made Trading Strategy
📈 Telegram (Learn Today): t.me/hashtaghammer
✅ WhatsApp (Learn Today): wa.me/919455664601
📈 Telegram (Learn Today): t.me/hashtaghammer
✅ WhatsApp (Learn Today): wa.me/919455664601
관련 발행물
면책사항
해당 정보와 게시물은 금융, 투자, 트레이딩 또는 기타 유형의 조언이나 권장 사항으로 간주되지 않으며, 트레이딩뷰에서 제공하거나 보증하는 것이 아닙니다. 자세한 내용은 이용 약관을 참조하세요.