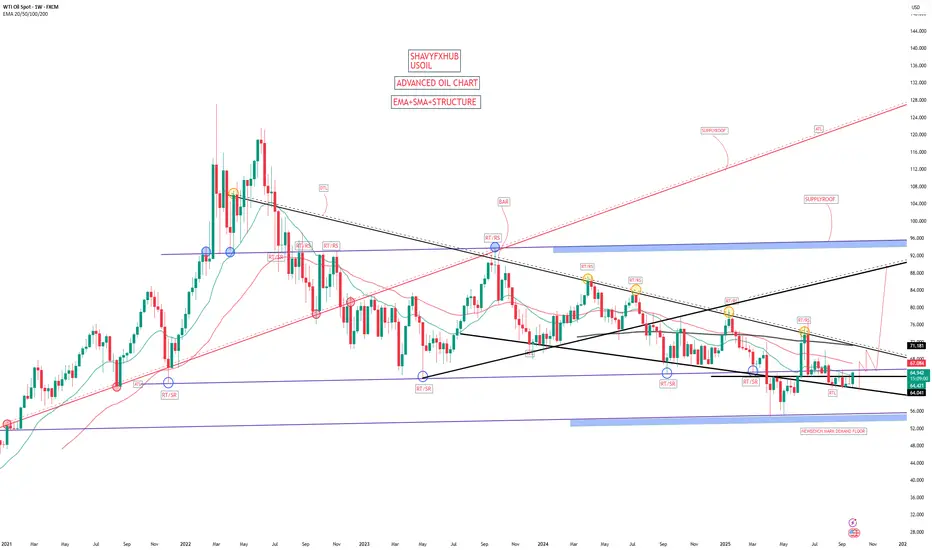
US OIL have a seen a sharp drop in price and buyers and opec kept April 2025 low at 54.93$-55$ zone and retested in the month of may 2025 at 54.93$-55$ zone ,this zone could be considered as weekly benchmark buying deman floor from our strategy.
As geopolitical tension cools off oil price surged but capped by long term descending trendline connecting as represented on the chart on weekly timeframe,at the moment we have bridged 64.041$ and it will expose 70.971$-71.82$ descending trendline acting as dynamic resistance to oil uprising for a long time .
if buyers and opec make critical change and demand exceeds supply then we are going long on the break of 70.971$-71.82$ into 88$-85$ zone before correction .
pls let me know if you like the analysis and if we have any error to help us win on oil forecast.
pls note that this is my perspective based on the strategy and it could have some error.
#oil #usoil #ukoil
면책사항
해당 정보와 게시물은 금융, 투자, 트레이딩 또는 기타 유형의 조언이나 권장 사항으로 간주되지 않으며, 트레이딩뷰에서 제공하거나 보증하는 것이 아닙니다. 자세한 내용은 이용 약관을 참조하세요.
면책사항
해당 정보와 게시물은 금융, 투자, 트레이딩 또는 기타 유형의 조언이나 권장 사항으로 간주되지 않으며, 트레이딩뷰에서 제공하거나 보증하는 것이 아닙니다. 자세한 내용은 이용 약관을 참조하세요.