On the daily timeframe, USOIL is in a clear downtrend.
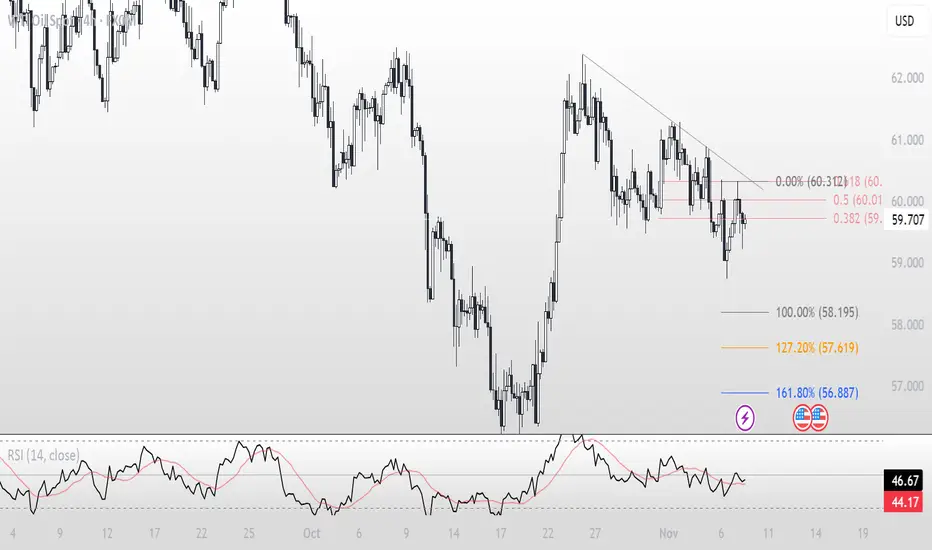
On the 4H timeframe, a bearish pattern has formed after breaking the previous low, followed by a corrective move up to the Fibonacci golden zone.
Bearish candles appeared in that area, indicating a possible continuation of the downtrend toward the downside targets.
Targets are shown on the chart — based on Fibonacci extension levels and a double top pattern.
Do you agree with this bearish setup?
면책사항
해당 정보와 게시물은 금융, 투자, 트레이딩 또는 기타 유형의 조언이나 권장 사항으로 간주되지 않으며, 트레이딩뷰에서 제공하거나 보증하는 것이 아닙니다. 자세한 내용은 이용 약관을 참조하세요.
면책사항
해당 정보와 게시물은 금융, 투자, 트레이딩 또는 기타 유형의 조언이나 권장 사항으로 간주되지 않으며, 트레이딩뷰에서 제공하거나 보증하는 것이 아닙니다. 자세한 내용은 이용 약관을 참조하세요.