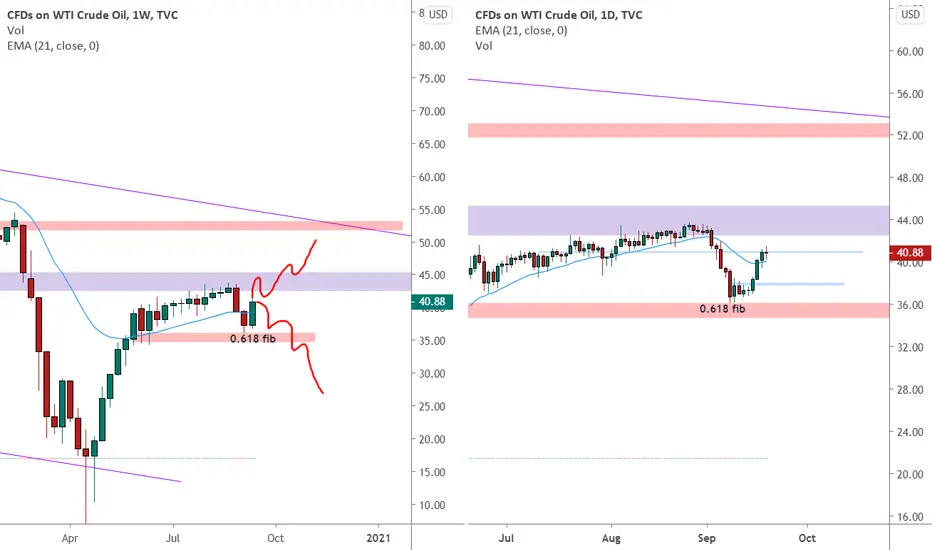
Oil on the Weekly chart hit the strong resistance near to a monthly level and start a retracement back.
The market after hit the lower weekly structure at the 0.618 fib level retracement and couldn’t manage to break below.
Price bounce over it and create a weekly double bottom higher close.
In the lower right chart (daily) we can see that price is now near to a minor daily resistance.
We will consider to open a position only at the break of the key level as shown on the chart.
–––––
Follow the Shrimp 🦐
Here is the Plancton0618 technical analysis , please comment below if you have any question.
The ENTRY in the market will be taken only if the condition of Plancton0618 strategy will trigger
면책사항
해당 정보와 게시물은 금융, 투자, 트레이딩 또는 기타 유형의 조언이나 권장 사항으로 간주되지 않으며, 트레이딩뷰에서 제공하거나 보증하는 것이 아닙니다. 자세한 내용은 이용 약관을 참조하세요.
면책사항
해당 정보와 게시물은 금융, 투자, 트레이딩 또는 기타 유형의 조언이나 권장 사항으로 간주되지 않으며, 트레이딩뷰에서 제공하거나 보증하는 것이 아닙니다. 자세한 내용은 이용 약관을 참조하세요.