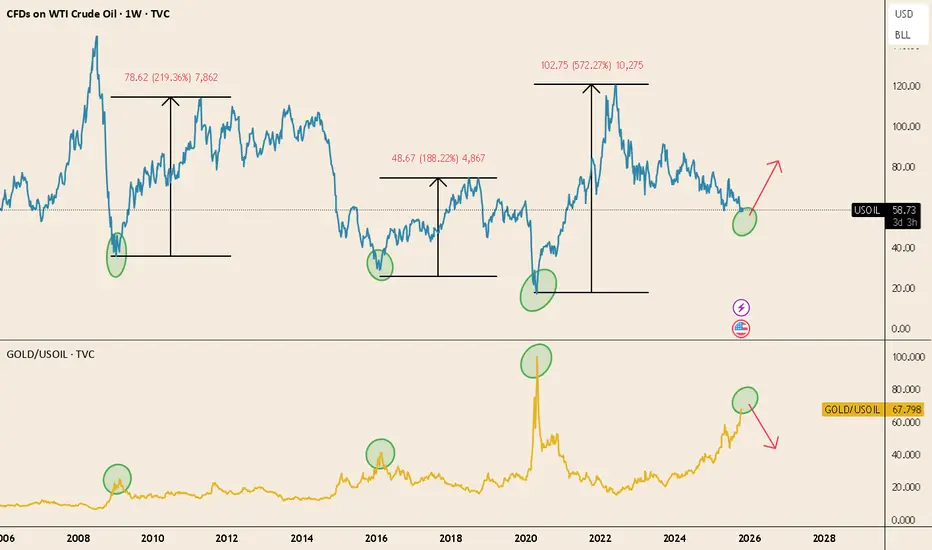
The chart compares WTI crude (top) and the Gold/Oil ratio (bottom) on a weekly basis.
Historically, when the Gold/Oil ratio spikes — meaning gold becomes very expensive relative to oil — it tends to mark the end of the precious metals phase and the beginning of the broader commodity cycle.
In the past three cycles:
-2009 → 2011: Oil +219%
-2016 → 2018: Oil +188%
-2020 → 2022: Oil +572%
We’re seeing the same setup again:
 USOIL sits at long-term support.
Gold/Oil ratio has reached historical extremes.
In each of these cases, gold had already led the move — followed by silver, industrial metals, and finally oil — the last to rally as growth and inflation expectations picked up.
If history rhymes, this could mark the rotation point where energy begins to outperform within the commodity complex.
Historically, when the Gold/Oil ratio spikes — meaning gold becomes very expensive relative to oil — it tends to mark the end of the precious metals phase and the beginning of the broader commodity cycle.
In the past three cycles:
-2009 → 2011: Oil +219%
-2016 → 2018: Oil +188%
-2020 → 2022: Oil +572%
We’re seeing the same setup again:
Gold/Oil ratio has reached historical extremes.
In each of these cases, gold had already led the move — followed by silver, industrial metals, and finally oil — the last to rally as growth and inflation expectations picked up.
If history rhymes, this could mark the rotation point where energy begins to outperform within the commodity complex.
면책사항
이 정보와 게시물은 TradingView에서 제공하거나 보증하는 금융, 투자, 거래 또는 기타 유형의 조언이나 권고 사항을 의미하거나 구성하지 않습니다. 자세한 내용은 이용 약관을 참고하세요.
면책사항
이 정보와 게시물은 TradingView에서 제공하거나 보증하는 금융, 투자, 거래 또는 기타 유형의 조언이나 권고 사항을 의미하거나 구성하지 않습니다. 자세한 내용은 이용 약관을 참고하세요.