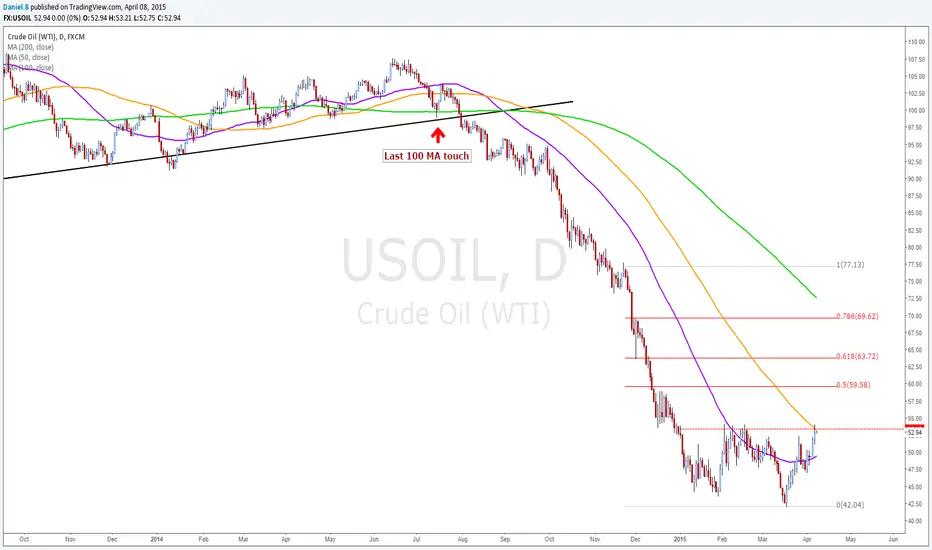
Well, as we all may of noticed by now, WTI crude is now testing this years highs, and a break above would mean that I look for more convenient buying opportunities. But the main point of this chart is to point out the numerous breakouts above the 50MA and more importantly the testing of the Daily 100MA resistance. Which is something we haven't seen since July of last year. There are many fundamental factors at play here, but I find it to time consuming to put a full on research report on T.V. lol. Anyhow, also marked on the chart are some resistance levels to keep in mind in the case of a break above.
면책사항
이 정보와 게시물은 TradingView에서 제공하거나 보증하는 금융, 투자, 거래 또는 기타 유형의 조언이나 권고 사항을 의미하거나 구성하지 않습니다. 자세한 내용은 이용 약관을 참고하세요.
면책사항
이 정보와 게시물은 TradingView에서 제공하거나 보증하는 금융, 투자, 거래 또는 기타 유형의 조언이나 권고 사항을 의미하거나 구성하지 않습니다. 자세한 내용은 이용 약관을 참고하세요.