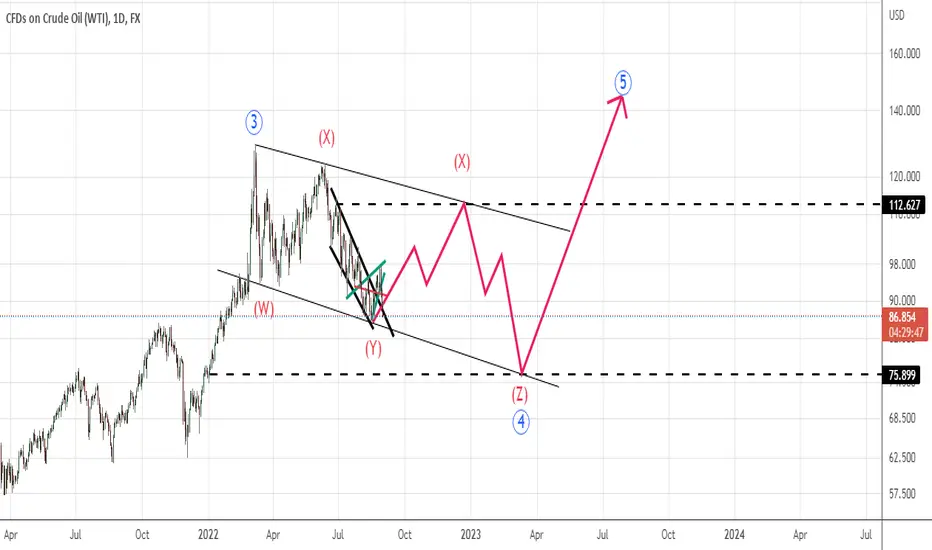
daily time frame wave count is a big picture of usoil wave sturcture as depicted on the chart indicating upward move toward 112-115 $ then going down for 75$ as these two numbers is taken from Kijensen and Tenkensen overlapped target and also our wolfe wave pattern and is in coincidence with USDCAD wave structure as below

if you have any comments about how you think for this analysis please share
thanks
if you have any comments about how you think for this analysis please share
thanks
면책사항
해당 정보와 게시물은 금융, 투자, 트레이딩 또는 기타 유형의 조언이나 권장 사항으로 간주되지 않으며, 트레이딩뷰에서 제공하거나 보증하는 것이 아닙니다. 자세한 내용은 이용 약관을 참조하세요.
면책사항
해당 정보와 게시물은 금융, 투자, 트레이딩 또는 기타 유형의 조언이나 권장 사항으로 간주되지 않으며, 트레이딩뷰에서 제공하거나 보증하는 것이 아닙니다. 자세한 내용은 이용 약관을 참조하세요.