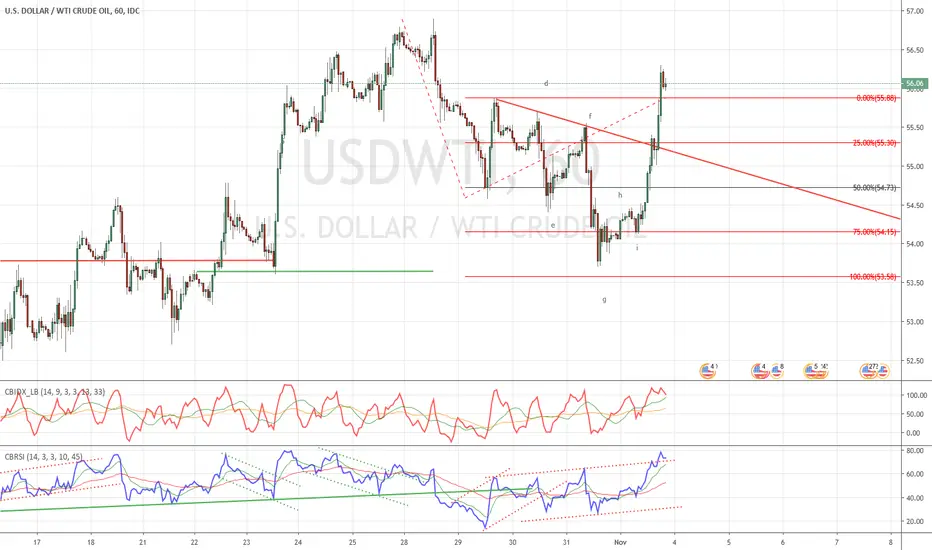
Yesterday the price action of WTI made a promising bullish setup.
First of all the bearish trend on the hourly chart, which started on October 28th, ended a few cents above the projected price range of $53,58.
Since then a strong opposite bullish price reaction has unfolded which broke many resistances.
Furthermore, the RSI broke out of a descending channel (negative reversal) and reached the 80 area, strengthening the bullish outlook of WTI.
Before getting long you should wait for a price pullback. This will give you the opportunity to calculate the price projections.
면책사항
이 정보와 게시물은 TradingView에서 제공하거나 보증하는 금융, 투자, 거래 또는 기타 유형의 조언이나 권고 사항을 의미하거나 구성하지 않습니다. 자세한 내용은 이용 약관을 참고하세요.
면책사항
이 정보와 게시물은 TradingView에서 제공하거나 보증하는 금융, 투자, 거래 또는 기타 유형의 조언이나 권고 사항을 의미하거나 구성하지 않습니다. 자세한 내용은 이용 약관을 참고하세요.