USDT Dominance Chart Update.
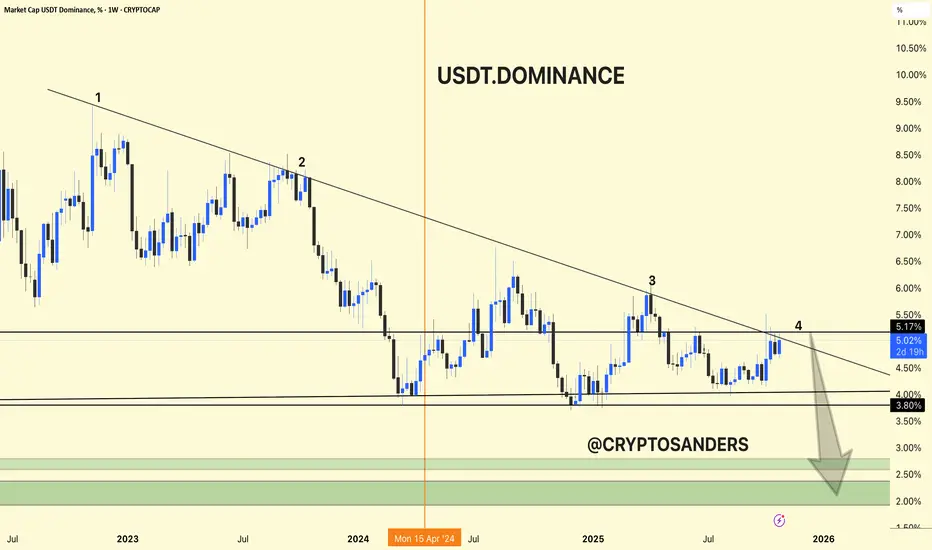
USDT dominance is again rejecting at the long-term trendline resistance (point 4), currently around 5.17%.
Structure suggests another potential move lower, with possible targets in the green zone (2.0%–3.0%) if the downtrend continues.
This scenario typically favors fresh capital rotation into Bitcoin and altcoins as traders de-risk from stablecoins.
Summary:
USDT dominance remains weak below the trendline. A sustained drop could spark further altcoin momentum and a broader crypto rally.
관련 발행물
면책사항
이 정보와 게시물은 TradingView에서 제공하거나 보증하는 금융, 투자, 거래 또는 기타 유형의 조언이나 권고 사항을 의미하거나 구성하지 않습니다. 자세한 내용은 이용 약관을 참고하세요.
관련 발행물
면책사항
이 정보와 게시물은 TradingView에서 제공하거나 보증하는 금융, 투자, 거래 또는 기타 유형의 조언이나 권고 사항을 의미하거나 구성하지 않습니다. 자세한 내용은 이용 약관을 참고하세요.