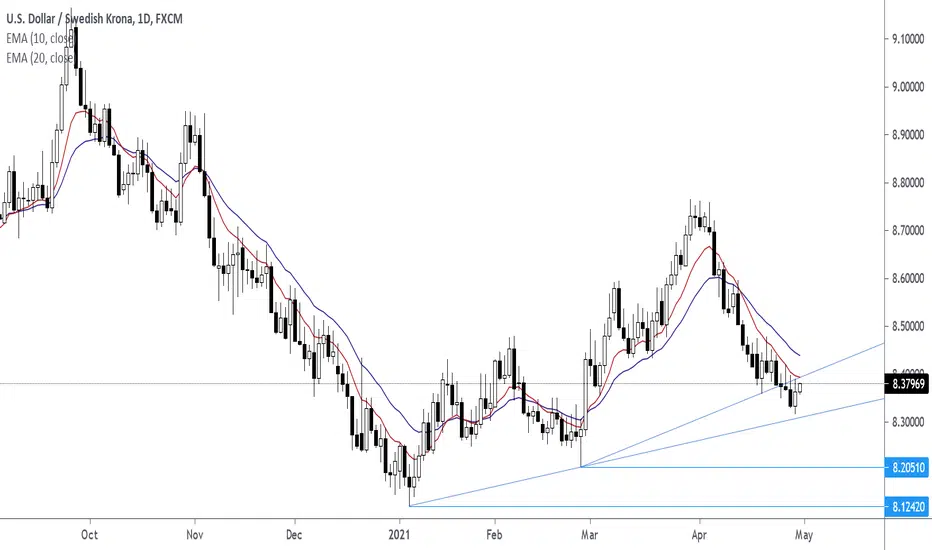
Lower Highs are pushing into trend line support. Wait for confirming price action signal like a pin bar for an entry. Lower Highs are present on the Daily, Weekly Chart, and H4 Chart.
EMA 10 EMA 20 are pointing downwards on the time frames mentioned.


EMA 10 EMA 20 are pointing downwards on the time frames mentioned.
면책사항
해당 정보와 게시물은 금융, 투자, 트레이딩 또는 기타 유형의 조언이나 권장 사항으로 간주되지 않으며, 트레이딩뷰에서 제공하거나 보증하는 것이 아닙니다. 자세한 내용은 이용 약관을 참조하세요.
면책사항
해당 정보와 게시물은 금융, 투자, 트레이딩 또는 기타 유형의 조언이나 권장 사항으로 간주되지 않으며, 트레이딩뷰에서 제공하거나 보증하는 것이 아닙니다. 자세한 내용은 이용 약관을 참조하세요.